
Slurry Pump Sizing Guide: How to Calculate Flow, Head, Solids, and Wear Requirements

Slurry pump sizing isn’t about picking a pump that moves clean water and adding “a bit of extra power.” It’s an engineering workflow that starts with the slurry itself — its density, solids concentration, particle size distribution, and chemical makeup — before you ever look at a pump curve. Get it wrong and you risk destroying wet ends, burning motors, clogging pipelines, or losing throughput on a schedule that rarely tolerates unexpected downtime.
This guide lays out the practical calculation path I’ve seen used on mining and mineral-processing projects: from slurry characterization and flow rate to slurry-corrected total dynamic head, NPSH margin, velocity constraints, and wear material selection. Every formula here is meant to feed a supplier RFQ that actually produces a pump capable of running at its best efficiency point over a long service interval, and not failing early due to overlooked slurry factors.
Don’t skip straight to the pump curve. Start with the data, work the corrections, and only then ask for a selection that makes engineering sense.
Quick Answer: How to Size a Slurry Pump Correctly
Slurry pump sizing means calculating the required flow rate and total dynamic head using slurry-specific properties — not water — then selecting a pump that operates near its best efficiency point with enough NPSH margin and wear resistance to handle the solids without cavitation, plugging, or excessive liner replacement. The core steps are:
- Define the slurry: solids concentration (Cw and Cv), specific gravity, particle size distribution (d50, d85), pH, and solids hardness.
- Calculate the slurry volumetric flow rate from dry solids throughput and slurry density.
- Estimate slurry-corrected total dynamic head, accounting for higher friction losses and static head from slurry density.
- Check NPSHa against NPSHr with an extra margin for abrasive service — cavitation in slurry pumps destroys liners far faster than in clean-water pumps.
- Choose liner material and impeller type based on particle size, sharpness, pH, and velocity.
- Verify the operating point sits between about 70% and 110% of BEP flow; far-left operation can reduce bearing life while far-right operation often accelerates wear and overloads the motor.
If you’re handed a water-based pump curve without slurry derating factors, push back. That selection frequently misrepresents power draw, wear rate, and actual system head.
Scope of This Guide
This article focuses on centrifugal slurry pump sizing for mining, mineral processing, dredging, sand and gravel, and similar abrasive-slurry transfer applications. You’ll find practical formulas, worked examples, velocity and wear trade-offs, NPSH guidance, and a pre-RFQ checklist. It does not cover positive-displacement slurry pumps, froth pumping in detail, or full CFD / non-Newtonian rheology modeling. For the broader selection logic beyond pure sizing, see our Slurry Pump Selection Guide: Abrasion, Solids Size, Material Choice, Head Loss, and Maintenance Risk.
What Information Is Required Before Slurry Pump Sizing?
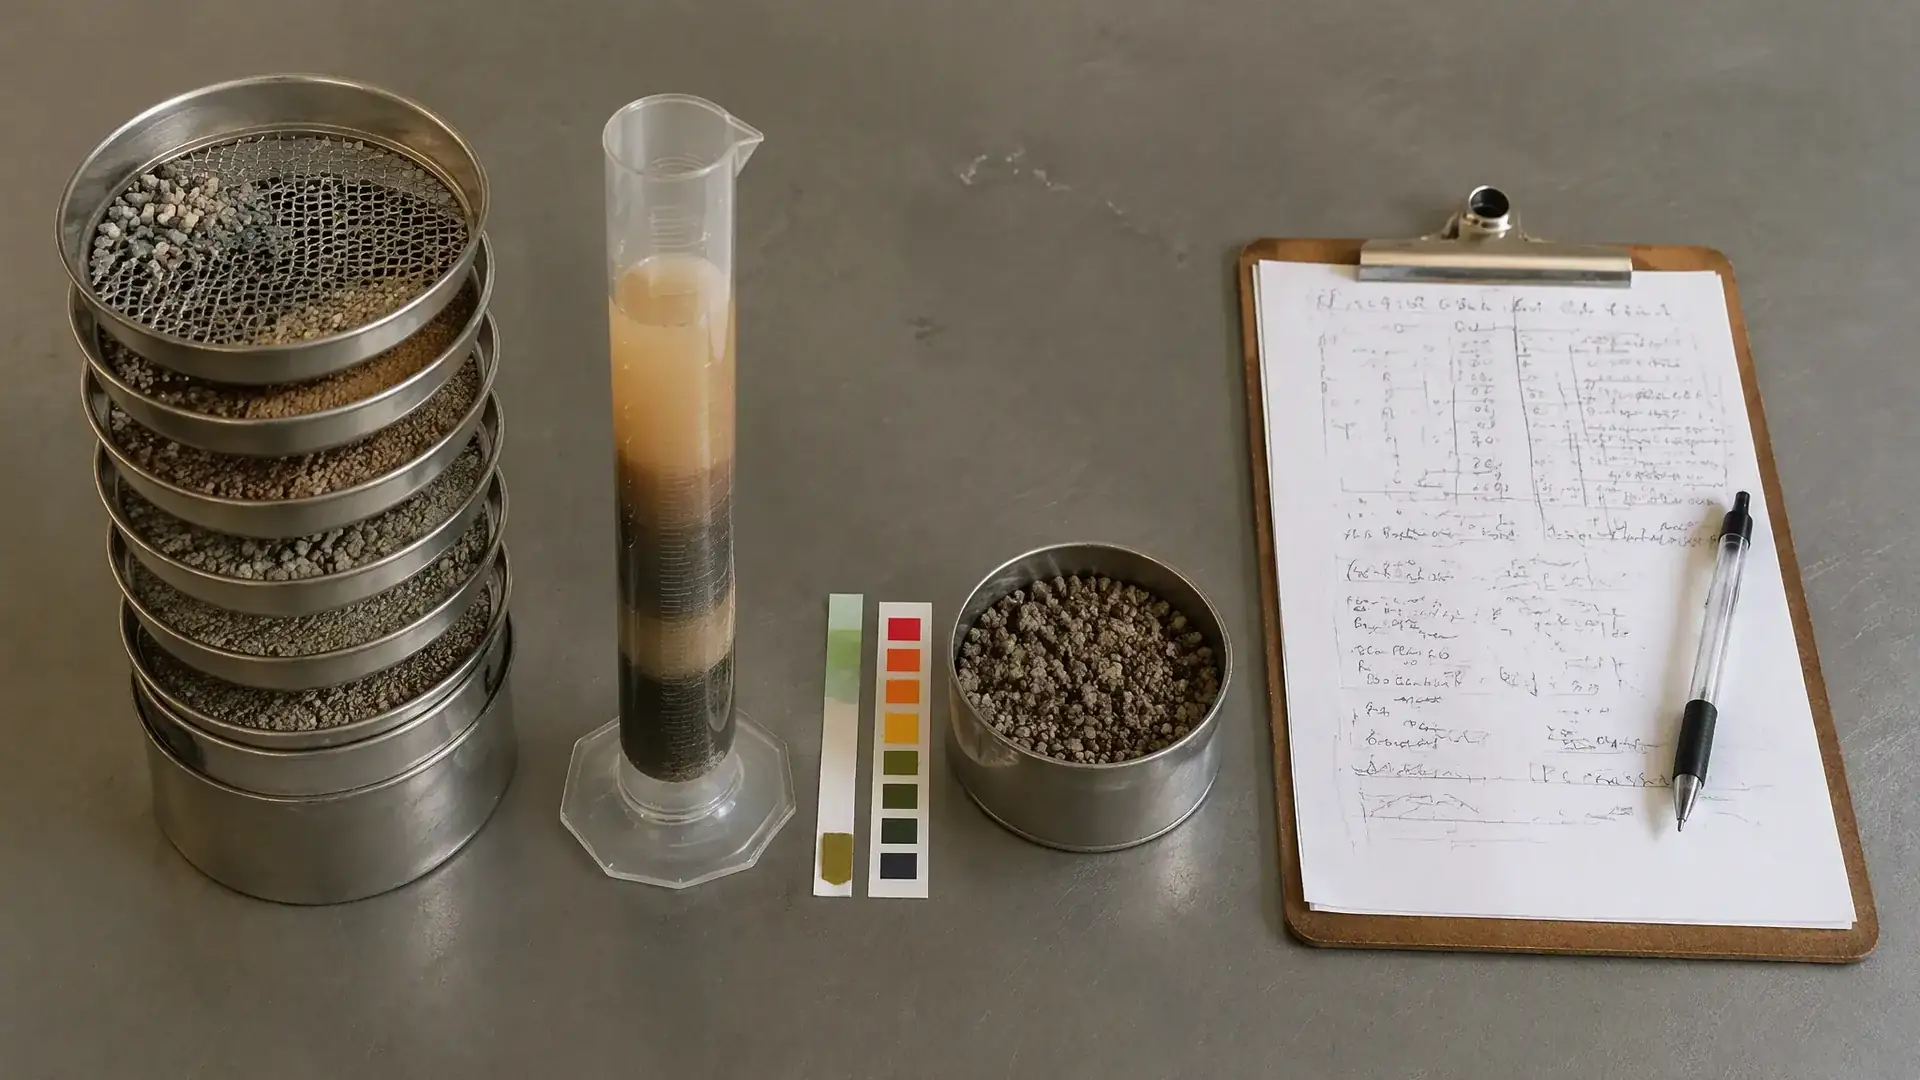
You can’t size a slurry pump from a single flow-and-head number. The pump reacts to the full slurry character — density, solids load, particle size, velocity limits, and chemical aggressiveness. Without this data, the supplier will either guess (and you’ll pay for it later) or refuse to quote until you clarify the missing parameters.
Here’s the minimum input sheet I’d want before running a slurry pump calculation:
- Volumetric flow rate requirement (m³/h or US GPM), or dry solids throughput (tonnes per hour) plus slurry SG
- Solids concentration by weight (Cw) and by volume (Cv)
- Specific gravity of dry solids — typically 2.65 for silica sand, higher for iron ore, lower for coal
- Slurry specific gravity (SGm) — the mixture density relative to water
- Particle size distribution: d50 and d85 are the two most useful numbers; also note any oversize or tramp material
- Solids hardness — Mohs scale or an indication of angularity and sharpness; freshly crushed ore is far more aggressive than rounded sand
- Slurry pH and any corrosive components (chlorides, acid, high-temperature process water)
- Static lift and pipe system layout: total pipe length, diameter, elevation change, and number/type of fittings
- Operating elevation above sea level (affects NPSHa and motor cooling)
- Duty cycle: continuous or intermittent, and whether the flow fluctuates significantly
If the slurry settles quickly in a beaker, you also need a settling velocity estimate — this determines the minimum pipeline velocity and directly impacts pipe wear and pump selection.
Parameter Summary Table
| Parameter | Unit | Why It Matters | Typical Source |
|---|---|---|---|
| Slurry volumetric flow | m³/h or US GPM | Defines pump size and BEP target | Process mass balance or pipeline design |
| Dry solids throughput | t/h | Required to convert from process solids to slurry flow | Mine plan or process flowsheet |
| Solids concentration Cw | % weight | Needed to calculate slurry SG and Cv | Slurry sampling or process model |
| Solids concentration Cv | % volume | Directly affects friction loss, wear, and settling | Derived from Cw and SG |
| Dry solids SG | — | Determines slurry density | Lab measurement or mineralogy data |
| Slurry SGm | — | Multiplies static head and affects friction | Calculated from Cw and dry SG |
| d50 particle size | µm or mm | Predicts settling velocity and wear zone intensity | Sieve analysis or laser diffraction |
| d85 particle size | µm or mm | Indicator of oversize load and impeller passage risk | Sieve analysis |
| Solids hardness | Mohs | Higher hardness drives liner material choice toward high-chrome or ceramic | Mineralogy report |
| pH | — | Below ~4 or above ~10 demands elastomer or stainless evaluation | Process water or slurry sample |
| Static lift | m or ft | Largest component of TDH in many mining circuits | Site survey or piping isometric |
| Pipe length & diameter | m & mm or inch | Determines friction head and velocity | Piping design |
| Elevation above sea level | m or ft | Reduces NPSHa and may require motor derating | Site elevation data |
| Duty cycle | hours/day | Influences bearing L10 life, seal selection, and spare planning | Operating philosophy |
How to Calculate Slurry Flow Rate and Solids Concentration
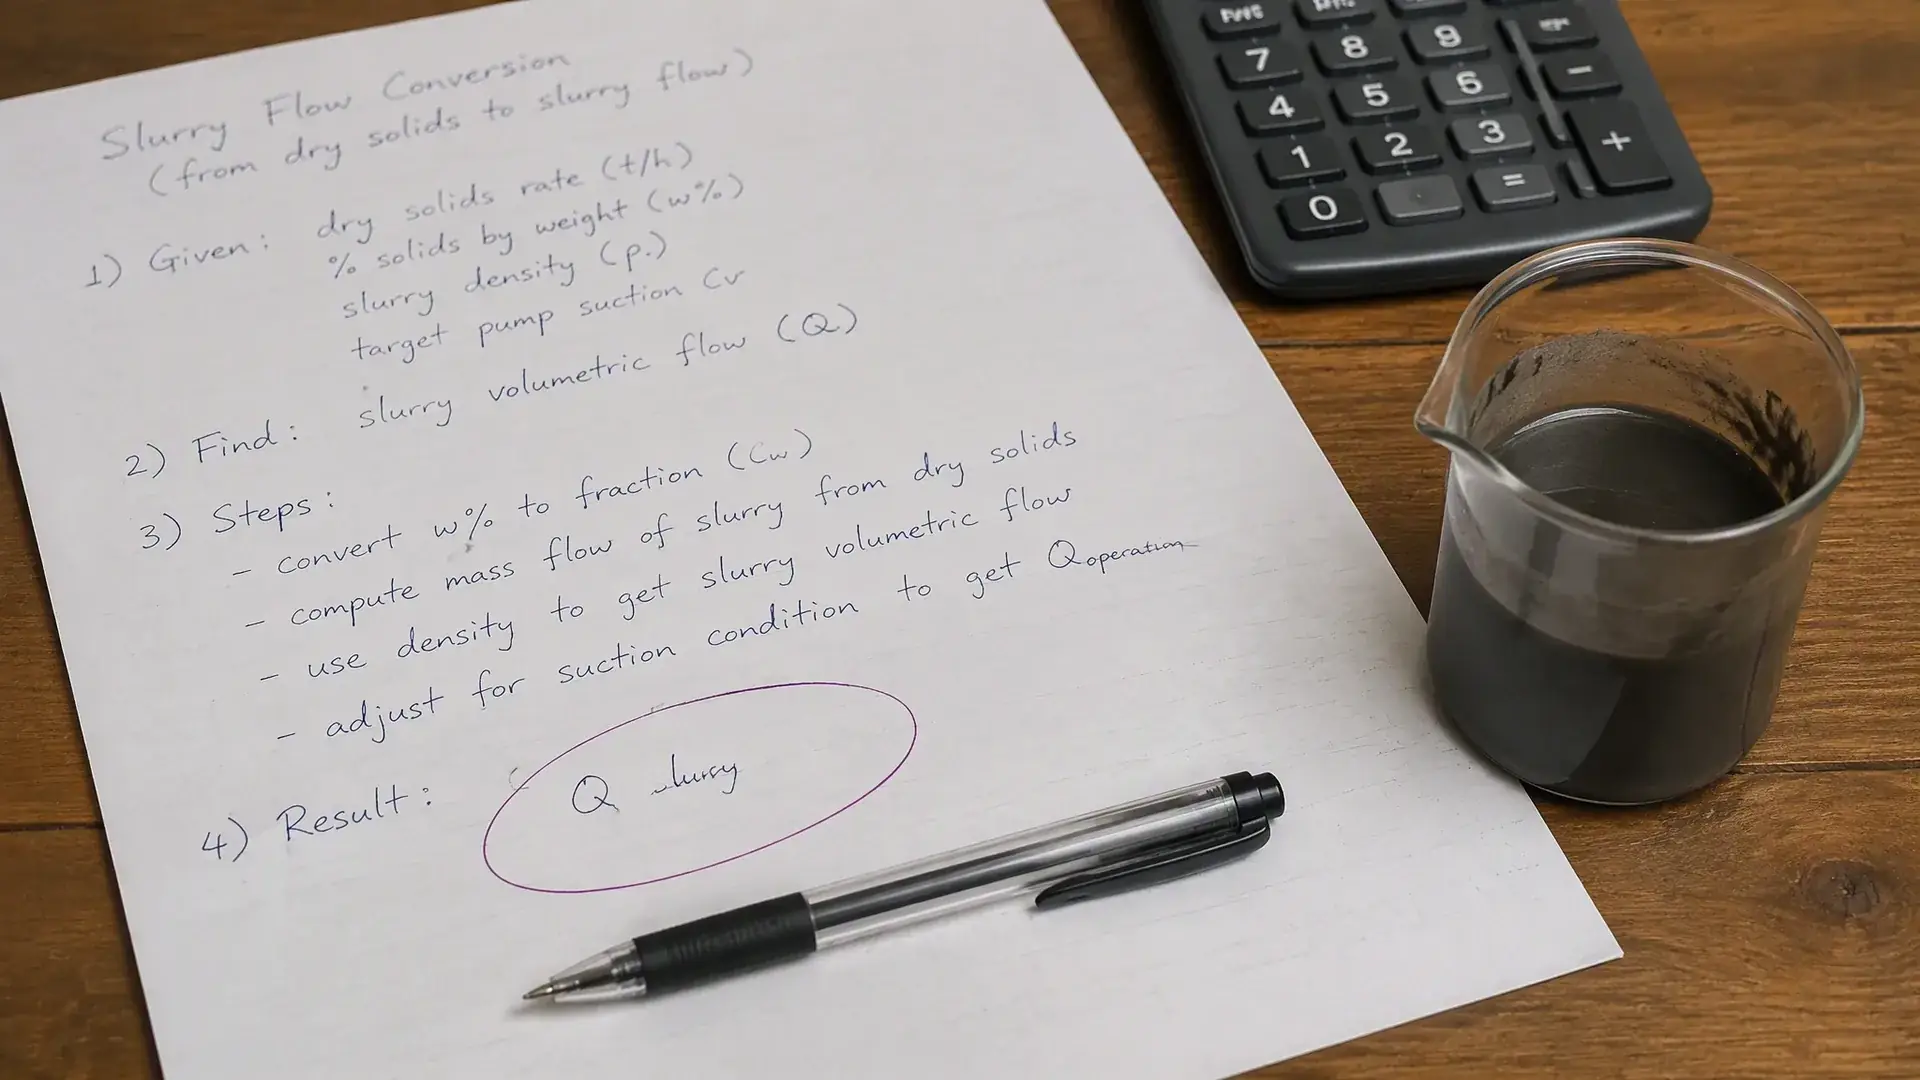
Most mining processes report dry solids throughput — say 500 t/h of copper tailings. The pump, however, moves slurry, not dry solids. You need to convert that dry tonnage into a volumetric slurry flow rate, and that requires knowing the solids concentration.
Cw and Cv: Two Ways to Describe Solids Concentration
Solids concentration by weight (Cw) is the mass percentage of solids in the slurry: - Cw = (mass of dry solids / total slurry mass) × 100
Engineers in the plant often work in Cw. But for pump hydraulic calculations, you need concentration by volume (Cv): - Cv = (volume of solids / total slurry volume) × 100
The conversion from Cw to Cv uses the specific gravities:
Cv (%) = [Cw × SGm] / SG_solids
Or equivalently:
Cv = [Cw / SG_solids] / [Cw / SG_solids + (100 − Cw) / 100]
where SG_solids is the dry solids specific gravity, and water is taken as SG = 1.0.
A practical note: for silica sand tailings at Cw ≈ 40%, Cv typically lands around 20–22%. For iron ore at Cw = 60%, Cv might be closer to 30–35% because of the higher solids SG.
Slurry Specific Gravity
Once you know Cv (as a decimal fraction), the slurry specific gravity is straightforward:
SGm = 1 + (SG_solids − 1) × Cv
Example: SG_solids = 2.65 (quartz sand), Cv = 0.20 (20%) SGm = 1 + (2.65 − 1) × 0.20 = 1.33
That means the slurry weighs 1.33 times as much as water — and every meter of static lift now costs you 33% more in pumping energy than clean water would.
Flow Rate Conversion
With solids throughput Q_solids in t/h, SG_solids, and Cw as a percentage:
Slurry flow Q_slurry (m³/h) = Q_solids / (SG_solids × Cw / 100 × SGm)
A simpler route when Cv is already known: first calculate the solids volumetric flow: Q_solids_vol (m³/h) = Q_solids (t/h) / SG_solids
Then: Q_slurry (m³/h) = Q_solids_vol / Cv
Worked mining example: 300 t/h dry tailings, SG_solids = 2.7, Cv = 0.25.
Solids vol flow = 300 / 2.7 = 111.1 m³/h Slurry flow = 111.1 / 0.25 = 444.4 m³/h
That’s the flow you take to the pump curve — not 300 m³/h.
How to Calculate Slurry TDH and Friction Loss
Total dynamic head for a slurry system is typically higher than the TDH you’d calculate with clean water. Two things drive the difference: the higher density of the mixture (which increases the pressure required to lift the slurry to a given height) and the additional friction losses from suspended solids.
The basic TDH equation stays the same:
TDH = H_static + H_friction + H_velocity + H_pressure
But in slurry service, you must be careful how you interpret “head.” Many engineers think in meters of water column (m WC) because pump curves are usually drawn in those units. When you are pumping slurry with SG 1.40, a 40‑m geometric lift does not change — the vertical distance is fixed. However, the pressure the pump must develop to lift that column is 40 m × 1.40 = 56 m of water column equivalent. In other words, for a given geometric elevation, the pump sees a higher discharge pressure and draws more power. This does not mean the geometric distance becomes 56 m; it means the pump’s required TDH expressed in meters of water column must allow for the higher specific gravity. When comparing against a pump curve, you should either convert your slurry static head into equivalent water head (by multiplying the geometric lift by SGm) or work in pressure units directly, then confirm the pump can deliver that pressure at the design flow. The important thing is that a pump selected for a 40‑m water head would be undersized because the static pressure demand and motor power are roughly 40% higher for the slurry case. To avoid errors, request that the supplier show a slurry‑corrected system curve that accounts for density and friction, not just a water curve.
Friction head is where things get messy. Slurries with fine particles at moderate concentrations sometimes behave as a homogeneous heavier fluid, and friction losses scale roughly with SGm. But coarse settling slurries develop a sliding bed or saltation at low velocities, and friction losses can spike unpredictably — or drop when a stationary deposit forms, only to cause a plug later.
The industry uses slurry friction correction factors (often derived from the Durand or Wilson models) rather than a single multiplier. The Hydraulic Institute’s ANSI/HI 12.1‑12.6 provides a framework for slurry pump performance testing and correction factors; recognized transport references such as Wilson, Addie, and Clift offer methods for slurry pipeline head loss estimation. Suppliers experienced in slurry transport will usually provide slurry-corrected system curves when you give them the full pipe layout and slurry properties. Ask them to show their friction loss methodology, not just a final head number.
Static Head vs Friction Head in Slurry Systems
Static head in slurry systems must be understood as a pressure‑demand issue rather than a simple length multiplication. The geometric elevation between the supply sump and the discharge point is fixed. What changes with slurry is the pressure required to lift that column: a 40‑m column of SG 1.40 slurry imposes 40 m × 1.40 × (water density × g) of pressure at the pump discharge. To represent this on a pump curve drawn in meters of water column, you would enter the equivalent water head of 56 m for the static component. The pump itself moves the slurry up 40 vertical meters; the static head component of the TDH equation, when expressed in meters of water column, becomes higher to reflect the heavier fluid. This distinction is important because engineers who blindly multiply the geometric height by SG without converting the rest of the curve can end up with mismatched pump selections. Always check whether the supplier’s performance curve is given in water head, slurry head, or pressure units, and ask how they handle density corrections.
How Velocity Changes Wear and Head Loss
Velocity is the single most powerful lever you control in slurry system design — and it’s a double-edged lever.
- Too low, and solids settle in the pipe, reducing effective diameter, raising friction unpredictably, and eventually plugging the line.
- Too high, and abrasive wear accelerates — pipe wall loss and pump wet-end erosion both increase dramatically in many slurries.
The “correct” velocity is the one just above the critical deposition velocity — the velocity below which a stationary bed starts to form. It depends on particle size, pipe diameter, solids SG, and concentration. For typical mining slurries with a pipe diameter in the 150–300 mm range, operational velocities often land between 1.5 and 3.5 m/s, with finer tailings at the low end and coarse sand or mill discharge at the high end.
You’ll feel this decision in your maintenance budget: a mill discharge line designed for 2.8 m/s might need pipe rotation or relining within a couple of years, while at 3.8 m/s it could wear through in months.
Why Slurry Pipe Diameter Strongly Affects TCO
Pipe diameter choice loops directly back into the pump selection and total cost of ownership. A smaller diameter raises velocity and friction head, which means a larger pump and motor, higher energy cost, and faster wear on both pipe and pump. A larger diameter reduces friction and velocity, but can increase capital cost and, if taken too far, may drop below the deposition velocity.
The smartest approach I’ve seen on long-distance tailings lines: run the economics for two or three pipe diameters, comparing pump capital cost, motor power, energy cost over several years of operation, pipe replacement frequency, and liner wear parts. The lowest initial pipe cost rarely yields the lowest lifecycle cost. This is also a good moment to review pump system design fundamentals — the pipe and pump are one hydraulic system, and isolating them into two procurement decisions creates expensive mismatches.
For step-by-step TDH calculation methods that apply to these slurry corrections, refer to our How to Calculate Total Dynamic Head (TDH) for Industrial Pump Systems.
Particle Size, Velocity, and Wear Considerations
Particle size distribution doesn’t just affect the pump sizing calculation — it fundamentally changes which wet-end configuration makes economic sense. A pump that handles -200 µm flotation tailings for years might fail in months on a +6 mm mill discharge, even at the same flow and head.
When High Velocity Prevents Settling but Accelerates Wear
If you’re pumping coarse, angular solids (freshly crushed ore, mill discharge, coarse sand), the wear rate can become severe at velocities much above about 3 m/s, depending on particle sharpness. The impeller and volute liner will show distinct erosion patterns — typically at the cutwater, at the impeller vane tips, and along the suction-side throat where flow accelerates.
In these systems, sometimes it’s cheaper to accept a slightly higher deposition risk in the pipe and plan for periodic flushing than to run at velocities that shred liners in a few months. The calculation is site-specific, and it’s one where an experienced slurry pump supplier should provide wear-rate estimates based on their material testing, not generic textbook numbers.
Conversely, fine-particle slurries with rounded solids (say, well-rounded sand below 150 µm) permit higher velocities before wear becomes the dominant cost driver. The wear regime shifts from gouging and cutting action toward a more uniform erosion pattern, and rubber liners can survive quite well if the pH and temperature stay within the elastomer’s limits.
Common Wear Zones in Slurry Pump Wet Ends
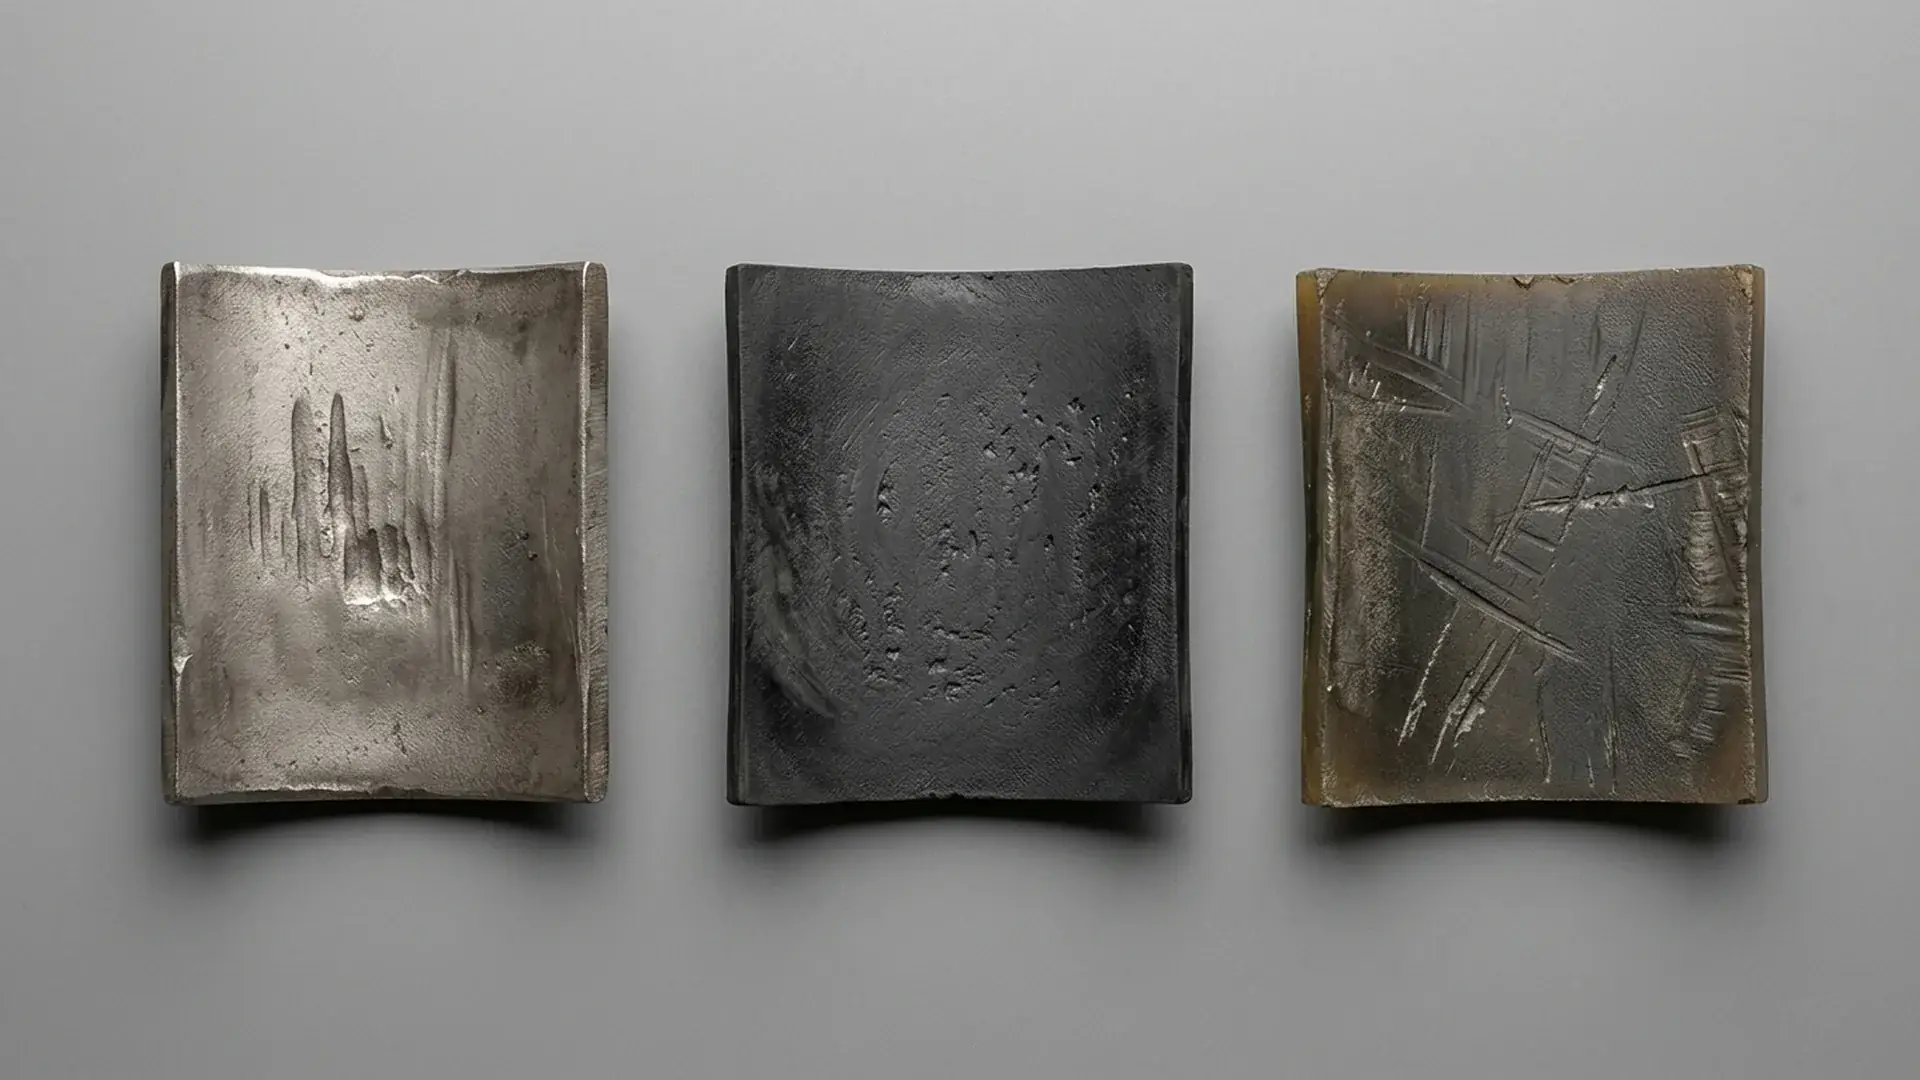
Regardless of slurry type, wear follows predictable patterns inside a centrifugal slurry pump. Understanding these helps you interpret inspection reports and negotiate spare parts strategies:
- Impeller vane leading edges and pressure sides: the top wear zone, especially with coarse solids. Vane thickness reduction here directly reduces head.
- Volute cutwater: the point where the casing tongue splits flow; high local velocities make this a classic erosion hotspot.
- Suction liner / throatbush: the area just before the impeller eye sees high acceleration and turbulence, and in abrasive service it wears quickly — once the clearance opens up, internal recirculation rises, efficiency drops, and wear accelerates further.
- Casing walls near the discharge nozzle: secondary flow patterns direct solids against the casing wall in a repeatable wear band.
If the pump operates far to the right of BEP, the wear rate at the cutwater and volute tongue intensifies because flow patterns become more chaotic. Operating far left of BEP increases recirculation inside the impeller and suction-side wear while also overloading the shaft and bearings with unbalanced radial loads. The best efficiency point isn’t just about power — it’s a wear-life and reliability sweet spot too.
NPSH Margin and Cavitation Risk in Slurry Pump Systems
Cavitation in a clean-water pump is bad. In a slurry pump, it’s catastrophic — abrasive solids multiply the damage because collapsing vapor bubbles drive particles into the impeller and liner surfaces with enough force to pit even high-chrome iron rapidly.
The trouble is that many slurry systems operate with low suction head: sumps, tailings ponds, and dredge applications where the pump sits near the liquid level or worse, lifts from below the centerline. NPSHa is inherently tight, and if someone calculates NPSHa using clean-water assumptions, it’s almost certainly wrong.
NPSHa vs NPSHr with slurry: The pump’s NPSHr doesn’t change much for slurry versus water — it’s a pump hydraulic characteristic. But NPSHa drops because the slurry SG increases vapor pressure effects slightly, and any suction-pipe deposition or partial blockage further reduces the available margin. The practical rule I’ve seen work on mining sites: NPSHa should exceed NPSHr by at least 1.5 meters for fine-slurry service and 2.0–2.5 meters for coarse, high-SG slurry. Some EPC specs demand a 3-meter margin on mill discharge pumps because the cost of a liner replacement and unplanned downtime often outweighs the small extra civil works cost to lower the pump or raise the sump.
For dredge applications, a submersible vertical slurry pump like our High Pressure Centrifugal Semi Submersible Sand Underwater Dredge Mining Vertical Slurry Pump may be considered when suction conditions are particularly challenging.
Check the suction pipe diameter carefully. Many slurry systems use oversized suction pipes to reduce entrance losses, but if the velocity drops too low in the suction line (<1.0–1.2 m/s for settling slurries), solids settle, the effective pipe area shrinks, and NPSHa collapses. A suction-side blockage doesn’t just starve the pump — it creates severe cavitation conditions that accelerate wet-end wear very quickly.
For a broader explanation of NPSH in pump systems, our How to Select the Right Pump: Complete Flow, Head, Pipe Size & System Design Guide covers NPSHa calculation and system curve interaction in detail.
Material and Liner Selection for Abrasive and Corrosive Slurry
The pump size calculation sets the hydraulic frame. The material choice determines whether that frame lasts. In slurry pump sizing, material selection should happen in parallel with hydraulic sizing — not as an afterthought — because the material influences the allowable velocity, the corrosion allowance, and the spare parts strategy.
Material Comparison Table
| Material | Abrasion Resistance | Corrosion Resistance | Typical Slurry Type | Limitations |
|---|---|---|---|---|
| High-chrome white iron (27% Cr) | Excellent for coarse angular solids | Low — does not tolerate acidic or chloride-rich slurry | Mill discharge, coarse tailings, sand and gravel | Brittle; pH below ~4 may attack the matrix; verify chloride levels |
| Natural rubber (soft, 35-40 Shore A) | Good for fine rounded particles | Excellent in acidic conditions (pH 2–12 typical) | Fine tailings, acid-leach slurries, flotation feeds | Max particle size typically ~6–8 mm; not for sharp angular solids; temperature usually below ~70°C |
| Polyurethane | Good for fine to medium particles | Good across a moderate pH range | Sand slurries, dredge discharge, some coal slurries | Temperature- and hydrolysis-sensitive; sharp particles can cut; check water temperature if above 40°C |
| Duplex stainless steel (CD4MCu) | Moderate | Excellent in high-chloride, oxidizing, or low-pH environments | Acid plant slurry, chemical-process abrasive streams | Higher cost than chrome iron; lower pure abrasion life on coarse hard solids |
| Ceramic (alumina or SiC) liners | Extreme abrasion resistance | Excellent chemical inertness | Ultra-fine abrasive slurries, flue-gas desulfurization, highly aggressive niche applications | Very brittle — impact or tramp material can crack liners; high initial cost; limited repairability in the field |
The above boundaries aren’t absolute — they’re the typical ranges you’d confirm with a supplier’s material data sheets and reference installations. For a mixed condition — say, a mildly acidic slurry with coarse, sharp solids — you might end up with a high-chrome material plus a pH buffer in the process, or a rubber-lined pump with frequent liner replacement factored into the operating cost. Neither is perfect, and that’s exactly why you need the supplier to show you their material wear data for a similar slurry.
The connection back to sizing: don’t assume one liner material will handle the whole slurry envelope if your process has start-up, normal, and upset conditions that vary significantly in pH, temperature, or particle size. Size the pump for the normal duty, but specify the liner material for the worst-case condition the pump will actually see — and tell the supplier what that worst case is.
Common Slurry Pump Sizing Mistakes That Increase Downtime
After decades of sizing errors and post-mortem conversations, a few patterns repeat across projects and continents. Most aren’t subtle — they’re shortcuts that seemed reasonable at the feasibility stage and turned into operational nightmares within the first year.
- Sizing from clean-water curves without slurry correction. The pump curve tells you what the pump does on water. The system tells the pump what head it must overcome — and a slurry system asks for more. If the supplier hasn’t applied a slurry derating factor (or better, built a slurry-system curve), you don’t actually know where the pump will run.
- Oversizing by more than about 10–15%. The safety-factor instinct says “add 20% more head and flow to be safe.” In slurry pumps, this can backfire. An oversized pump operates left of BEP, which increases internal recirculation, accelerates suction-liner wear, and imposes unbalanced radial loads on the shaft and bearings. You end up with higher energy cost, shorter bearing life, and faster wet-end consumption — exactly the opposite of safety.
- Ignoring future wear in the initial selection. A new pump with tight clearances hits its duty point. After several thousand hours, clearances begin to open up, internal leakage increases, and the pump’s effective head drops. If you sized right at the duty point with no allowance for wear, you’re already falling short well before the first scheduled liner replacement. Build in a small wear margin — not by oversizing the pump, but by selecting a pump whose curve at the initial impeller diameter sits slightly above the required head, so that even with some wear the pump still delivers.
- Low pipe velocity to reduce wear — at the cost of settling. Some site engineers push for the lowest feasible velocity to extend pipe life, then wonder why pipes plug on night shift when the slurry concentration drifts up. Critical deposition velocity isn’t a constant — it shifts with concentration and particle size distribution changes. If your slurry varies, stay above the worst-case deposition velocity, not the average.
- Insufficient NPSH margin in suction-lift or sump installations. Cavitation plus abrasive solids equals rapid localized liner erosion — you can usually spot it as a band of pitting just behind the impeller vane inlet. Adding half a meter more NPSH margin costs a bit of civil work or a slightly deeper sump, but it’s far cheaper than frequent impeller replacement.
- Selecting material only for normal pH, not upset conditions. A mill circuit might run at pH 10.5 normally but drop to pH 4 during a process upset or cleaning cycle. If the pump liners are plain carbon steel or a low-chrome alloy, one shift of acidic flow can destroy the wet end. Ask the process engineer for upset conditions, not just design conditions.
Slurry Pump RFQ Checklist for EPC and Mining Buyers
A complete RFQ packet forces the supplier to do proper sizing work instead of pulling a standard-curve selection off the shelf. Here’s what to include:
| RFQ Field | What to Specify |
|---|---|
| Slurry type and source | Tailings, mill discharge, dredge sand, ash, chemical slurry — name the process step |
| Flow rate | Required m³/h (or US GPM) at the pump suction, including any expected variation |
| Dry solids throughput | t/h or kg/s if flow rate is not yet fixed |
| Solids concentration Cw | % by weight |
| Solids concentration Cv | % by volume (or allow supplier to calculate from Cw and SG) |
| Dry solids SG | — |
| Slurry SGm | — (or let supplier calculate; specify which one you prefer) |
| Particle size distribution | d50, d85, maximum particle size; attach full sieve table if available |
| Solids hardness / description | Mohs, or description (e.g. “angular crushed quartz, 6–7 Mohs”) |
| Slurry pH | Design pH and any upset range |
| Slurry temperature | °C |
| Static lift | m or ft from sump level to discharge point |
| Pipe system | Total length, diameter, material, number and type of elbows/valves |
| Elevation above sea level | m or ft |
| Power supply | Voltage, phase, frequency, and any starting method constraints |
| Duty cycle | hours/day, starts per day |
| Liner material preference | High-chrome iron, rubber, polyurethane — or ask supplier to recommend |
| Seal type preference | Gland packing, expeller seal, or mechanical seal — or ask for options |
| Required documentation | Performance curve (slurry-corrected), NPSHr data, material certificates, dimensional drawing, test standard reference |
| Inspection and testing | Factory hydraulic test, material test certificates, witnessed test if required |
| Spare parts | Request recommended commissioning spares and 2-year operating spares list |
| Packaging and shipping | Sea-worthy packing, or specify requirements for containerized / flat-rack shipment |
Before sending this, verify that you haven’t mixed t/h dry solids with m³/h slurry flow — it’s one of the most common errors in slurry pump RFQs, and it guarantees a round of clarification emails before you get a quotation.
FAQ
These questions come up repeatedly in technical bid evaluations and project review meetings. The answers reflect what I’d tell an engineer who needs a defensible decision, not a textbook reply.
Can I use clean-water pump curves for slurry service?
No. A clean-water curve shows the pump’s performance on water. Your slurry system requires more head due to higher fluid density and additional friction losses, and the pump’s efficiency on slurry typically drops below its water efficiency. ANSI/HI slurry pump standards caution that using water curves without derating can misrepresent power draw and system head. For reliable slurry pump sizing, insist on a slurry-corrected performance curve or at minimum a derating factor with a documented basis. If your selection relies only on the water curve, you’ll likely run at a lower-than-expected flow, or the motor will overload when the pump tries to meet the duty point.
What is a safe NPSH margin for slurry pumps?
For fine-particle slurries (below ~200 µm, moderate concentration), many mining sites use a margin of about 1.5 meters above NPSHr as a starting point — this is based on common field practice, not a rigid standard. For coarse, high-SG slurries like mill discharge, project-specific evaluations frequently land between 2.0 and 2.5 meters. The appropriate margin depends on slurry rheology, suction geometry, elevation, and the supplier’s own testing and service experience. Some EPC contracts specify a 3-meter margin as a blanket requirement on all slurry pumps — it’s conservative, but on a remote mine site, conservative pays. The key is to ask the pump manufacturer to justify their recommended margin with reference data from similar slurry types and installations.
How much oversizing margin should a slurry pump have?
As little as possible beyond what’s needed for process variation. If your flow and head requirements are well-defined, 5–10% margin on flow and head via impeller diameter selection is typical, provided it still keeps the operating point within about 70–110% of BEP flow. Do not add margin by moving to a larger pump frame — that almost always pushes operation far left of BEP and creates the wear-reliability problems described earlier. The right way to handle future expansion: size the pump for the present duty, specify a motor sized for the future duty, and plan for an impeller change or pump upgrade later.
Which liner material is better for acidic slurry?
Natural rubber liners generally handle acidic conditions (pH 2–10) better than high-chrome iron, which can suffer selective matrix corrosion at low pH. For very aggressive acid slurries — strong sulfuric acid leach, for instance — the selection might lean toward rubber-lined pumps with appropriate rubber compound formulation, or toward duplex stainless or even ceramic-lined pumps depending on temperature and abrasion load. Ensure you provide the full pH range, temperature, and chloride concentration to the supplier and ask for material compatibility data, not just a yes/no recommendation.
Why does slurry pump efficiency drop over time?
Efficiency falls as internal clearances open up from wear. The impeller-to-suction-liner gap and the impeller-to-volute clearances determine how much slurry recirculates internally instead of leaving the discharge nozzle. As those clearances grow, the pump wastes more energy moving slurry in circles, and the effective flow and head at the discharge drop. This is why a wear-allowance strategy matters: the initial selection should ensure that even with some clearance growth, the pump still meets the minimum required head and flow. Once efficiency drops below an economic threshold (often around a 10–15% drop from new), it’s time to replace wear parts — even if the pump hasn’t failed.
References and Methodology Notes
The slurry pump sizing guidance in this article draws on established industry resources. Engineers preparing detailed calculations or verification should consult:
- ANSI/HI 12.1–12.6: Hydraulic Institute standards covering centrifugal slurry pumps, including performance testing, nomenclature, and derating for solids effects.
- Slurry Transport Using Centrifugal Pumps (Wilson, Addie, Sellgren, and Clift): A widely referenced text for slurry pipeline head loss estimation, deposition velocity calculation, and pump-system interaction.
- Supplier-specific slurry pump selection software and wear-life databases, when qualified with site-specific slurry characterization.
These references provide the underlying framework for many of the correction factors, velocity limits, and performance adjustment concepts discussed above. When negotiating with suppliers, ask them to reference which methods and data sources they use so you can cross-check assumptions. No single standard prescribes a universal sizing rule; always adapt the approach to the actual slurry, pipe system, and operating context.
Conclusion
Slurry pump sizing is first a data problem and second a pump-curve problem. If the slurry characterization is incomplete, the best pump selection software in the world won’t save you from a mismatched installation. Get the flow conversion right, build a slurry-corrected TDH estimate, verify your NPSH margin for the worst-case slurry condition, and choose liner materials that survive the upset scenarios, not just the design case. Then present that data in a structured RFQ that forces the supplier to show their work — the derating factors, the wear-rate assumptions, and the test references. That’s how you end up with a pump that meets the duty point today and holds it long enough between overhauls to make the project economics work.
Get A Quote

Get A Quote
0 Comments