
How to Lower Lifecycle Pump Cost: A Practical Guide for Industrial Buyers and Engineers
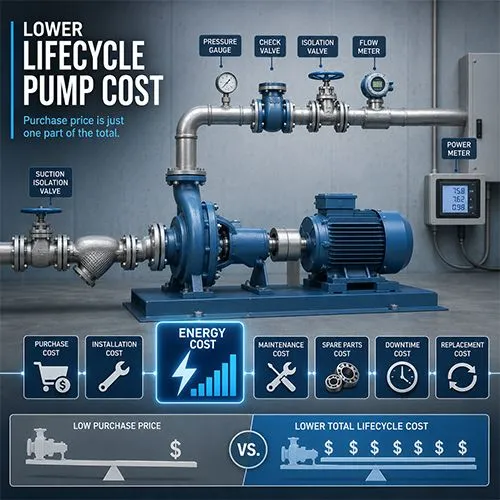
Lowering lifecycle pump cost starts with choosing, operating, and maintaining the pump system based on total ownership cost—not only purchase price. In many industrial pump projects, the lowest-priced pump is not always the lowest-cost pump. Energy use, operating hours, pump efficiency, maintenance frequency, spare parts, downtime, installation quality, liquid condition, and replacement timing usually have a larger impact on long-term cost than the initial quotation.
A practical lifecycle pump cost strategy helps buyers answer one key question: which pump option delivers the required flow, head, reliability, and service life at the lowest safe total cost?
This guide is written for B2B buyers, plant engineers, procurement managers, EPC contractors, maintenance teams, and project owners who need to reduce pump lifecycle cost without increasing failure risk, process downtime, or hidden operating expenses.
Quick Answer: How Can Buyers Lower Lifecycle Pump Cost?
The best way to lower lifecycle pump cost is to evaluate the complete pump system cost before purchase and verify actual operating cost after installation. Buyers should compare purchase price, energy cost, pump efficiency, motor load, operating hours, maintenance intervals, spare parts, downtime risk, installation quality, and supplier support.
Lifecycle pump cost is the total cost of owning and operating a pump system over its useful life, including purchase price, installation, energy consumption, maintenance, spare parts, downtime, repair, efficiency loss, and replacement.
A lower-priced pump may be reasonable for low-runtime, non-critical, clean-water service when efficiency difference, downtime risk, spare parts cost, and repair complexity are small. However, for high-runtime, critical, abrasive, corrosive, high-temperature, or difficult-duty systems, the cheapest pump often becomes more expensive over its full service life.
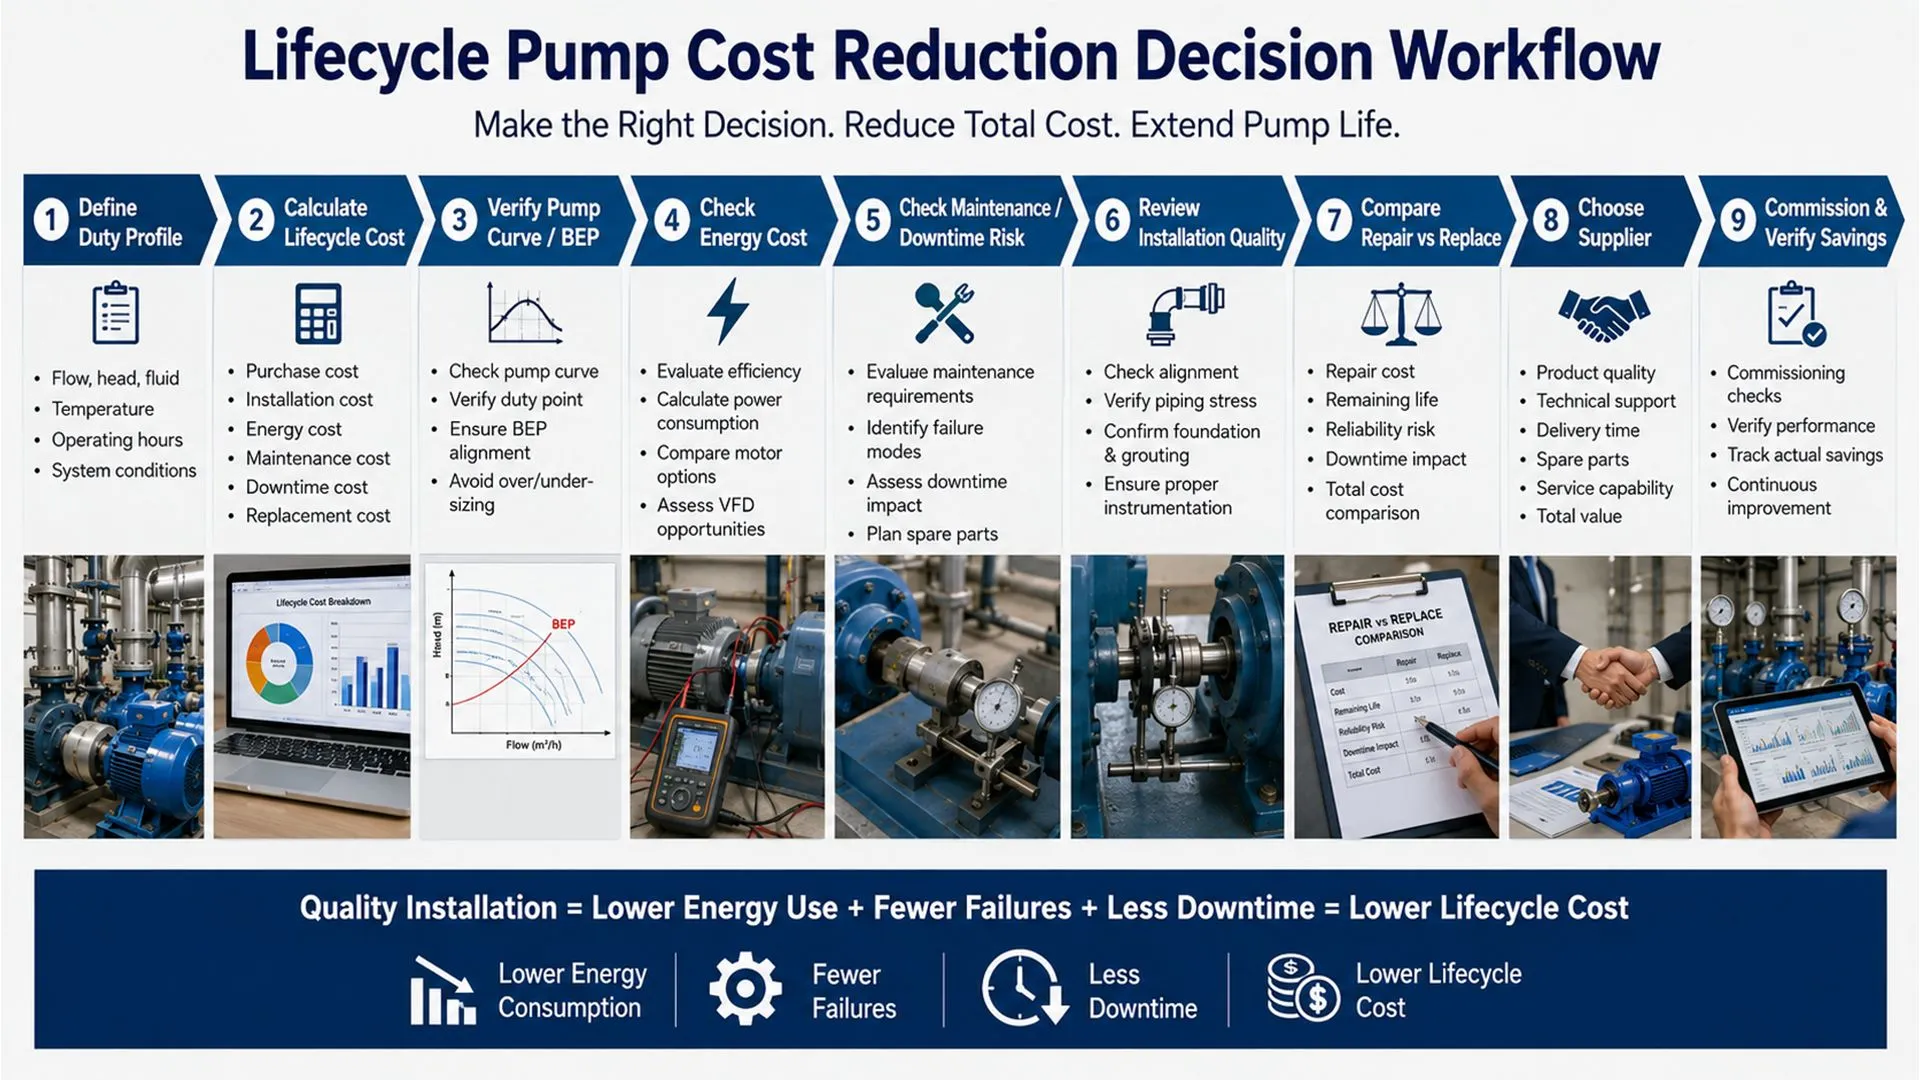
The usual cost-reduction sequence is:
- Define the real duty profile, not only peak flow and head.
- Select the pump near its efficient operating range.
- Compare energy cost using actual operating hours.
- Avoid excessive oversizing and permanent throttling.
- Verify pump curve, efficiency curve, and power curve.
- Choose materials, seals, bearings, and motor correctly for the liquid and duty.
- Install the suction and discharge piping correctly.
- Track flow, head, kW, vibration, seal condition, and maintenance history.
- Decide repair or replacement based on measured cost, not habit.
- Require supplier data before approving the quotation.
Standard answer: To lower lifecycle pump cost, buyers should compare pump options by total ownership cost, including purchase price, installation, energy use, operating hours, efficiency, maintenance frequency, spare parts, downtime risk, repair cost, replacement timing, and commissioning verification.
30-Second Lifecycle Pump Cost Checklist for Buyers
This quick checklist helps procurement and engineering teams avoid choosing a pump only by initial purchase price. It shows what should be checked before approving a pump quotation or replacement project.
| Cost Check | Why It Matters | Buyer Action |
|---|---|---|
| Purchase price | Only the first cost, not total cost | Compare with energy and maintenance cost |
| Operating hours | Long runtime magnifies energy cost | Estimate annual running hours |
| Pump efficiency | Affects power consumption every hour | Ask for efficiency at actual duty point |
| Power curve | Shows real shaft power across flow range | Require supplier power curve |
| Motor efficiency | Affects electrical input cost | Check motor efficiency class and loading |
| Duty point vs BEP | Off-BEP operation increases energy and wear | Plot duty point on pump curve |
| Oversizing margin | Excess margin can create throttling cost | Avoid unnecessary safety factor |
| Liquid properties | Density, viscosity, solids, and temperature affect load | Provide real liquid data in RFQ |
| Maintenance interval | Frequent repairs increase ownership cost | Ask for maintenance plan and spare parts |
| Spare parts cost | Low pump price may hide expensive parts | Request spare parts price list |
| Spare parts lead time | Long lead time increases downtime risk | Ask for critical parts availability |
| Downtime cost | Failure may cost more than the pump | Estimate process interruption cost |
| Installation quality | Poor piping shortens pump life | Review suction and discharge layout |
| Control method | VFD or fixed speed affects cost | Compare duty profile and system curve |
| Commissioning data | Verifies real performance | Record flow, head, kW, vibration, current |
| Supplier support | Reduces long-term risk | Check documentation, parts, and response time |
This checklist should be used before issuing a purchase order. Once the pump is installed, many lifecycle cost problems become more expensive to correct.
Scope of This Guide: Which Pump Systems Does This Apply To?
This guide mainly applies to industrial centrifugal pump systems where lifecycle cost is strongly affected by energy consumption, hydraulic efficiency, operating hours, maintenance frequency, and system design. It is especially useful for water supply, HVAC, cooling water, municipal pumping, irrigation, booster systems, RO pretreatment, process water transfer, wastewater transfer, power plant auxiliary systems, and general industrial utility services.
The guide is most valuable when pumps run many hours per year, serve critical processes, operate in corrosive or abrasive liquids, or require stable reliability for production continuity.
Applicable Pump Types
The lifecycle cost logic applies to many pump types, but the cost drivers differ by pump design and application.
| Pump Type | Main Lifecycle Cost Driver | Key Buyer Check |
|---|---|---|
| End suction pump | Efficiency, seal life, impeller wear | Duty point, material, seal, maintenance |
| Split case pump | Energy cost due to high flow and long runtime | Efficiency curve, bearing life, alignment |
| Multistage pump | Excessive head, stage selection, seal stress | Power curve, minimum flow, pressure requirement |
| Inline pump | HVAC runtime and control logic | VFD setpoint, duty profile, motor load |
| Pipeline pump | Pipe friction and continuous operation | System curve, valve loss, flow demand |
| Booster pump package | Pressure control and sequencing | VFD control, pressure setpoint, redundancy |
| Submersible pump | Motor cooling, cable loss, clogging | Liquid level, solids, cable sizing |
| Wastewater pump | Clogging, solids, impeller wear | Solids handling, access, cleaning frequency |
| Slurry pump | Wear parts, solids velocity, abrasion | Liner material, impeller wear, pipe velocity |
| Vertical turbine pump | Bowl wear, water level, column losses | NPSH, submergence, shaft alignment |
Use With Adjustment for Special Pump Systems
This guide should be adjusted for fire pumps, slurry pumps, chemical pumps, dosing pumps, diaphragm pumps, screw pumps, and other positive displacement pumps.
For fire pumps, lifecycle cost cannot override code-required flow and pressure. For slurry pumps, reducing speed or flow too aggressively may cause solids settlement and pipe blockage. For chemical pumps, material compatibility, seal safety, vapor pressure, and leakage risk may matter more than a small efficiency gain. For positive displacement pumps, lifecycle cost must include torque, relief valve behavior, viscosity, pulsation, and pressure control rather than centrifugal pump curve logic.
What Is Included in Pump Lifecycle Cost?
Pump lifecycle cost includes every cost required to purchase, install, operate, maintain, repair, and eventually replace a pump system. The purchase price is only one part of the total cost.
Lifecycle Pump Cost = Purchase Cost + Installation Cost + Energy Cost + Maintenance Cost + Spare Parts Cost + Downtime Cost + Repair Cost + Replacement Cost − Residual Value
For most industrial pumps, the largest long-term cost is often energy consumption, especially when the pump runs thousands of hours per year. However, in critical production systems, downtime cost can exceed energy cost and purchase cost combined.
| Cost Category | What It Includes | Why Buyers Miss It |
|---|---|---|
| Purchase cost | Pump, motor, baseplate, coupling, accessories | Easy to compare in quotations |
| Installation cost | Piping, foundation, valves, instruments, alignment | Often handled by a different team |
| Energy cost | kW × operating hours × electricity price | Not shown clearly in cheap quotations |
| Maintenance cost | Labor, inspection, lubrication, cleaning | Treated as future operating expense |
| Spare parts cost | Seals, bearings, wear rings, impellers, gaskets | Not included in initial price |
| Downtime cost | Lost production, emergency repair, rental pump | Hard to estimate before failure |
| Repair cost | Workshop repair, machining, testing | Appears after warranty or failure |
| Replacement cost | New pump, retrofit work, installation | Delayed until performance becomes unacceptable |
| Efficiency loss cost | Extra kWh from wear, throttling, or off-BEP operation | Hidden unless measured |
| Disposal or residual value | Scrap value or disposal cost | Usually small but still part of lifecycle view |
The most important procurement lesson is simple: a pump quotation without energy, maintenance, spare parts, downtime, and commissioning assumptions is not a lifecycle cost comparison.
How to Calculate Pump Lifecycle Cost Step by Step
Pump lifecycle cost calculation does not need to be complicated at the first screening stage. Buyers need a repeatable method that procurement, engineering, finance, and maintenance teams can all understand.
Step 1: Define the lifecycle period
Start by choosing a comparison period, such as 5, 10, or 15 years. The period should match the expected service life, project evaluation period, or company investment policy.
Step 2: Define the real duty profile
Do not calculate lifecycle cost using only peak flow and peak head. Record normal flow, minimum flow, peak flow, seasonal demand, operating hours, standby operation, and process variation.
Step 3: Estimate purchase and installation cost
Include pump, motor, baseplate, coupling, valves, instruments, piping adjustment, foundation, alignment, electrical work, VFD panel if required, and commissioning.
Step 4: Calculate annual energy cost
Use measured or supplier-confirmed input kW at the actual duty point.
Annual Energy Cost = Input kW × Annual Operating Hours × Electricity Price
Step 5: Add maintenance and spare parts cost
Include planned maintenance labor, seals, bearings, wear rings, lubricants, gaskets, impeller repair, casing inspection, and overhaul intervals.
Step 6: Estimate downtime cost
Downtime cost should include production loss, labor, emergency freight, rental pump, environmental risk, customer delay, or process restart cost.
Downtime Cost = Downtime Hours × Cost per Hour
Step 7: Compare repair, retrofit, and replacement timing
If an old pump is still running but energy and repair cost are rising, compare continued repair with replacement. Include energy penalty, repair frequency, downtime probability, and remaining service life.
Step 8: Verify after commissioning
After installation or improvement, record actual flow, head, kW, current, vibration, valve position, bearing temperature, and seal condition. Lifecycle cost calculation should be updated with real commissioning data, not left as a quotation-stage assumption.
Lifecycle Cost Comparison Example: Low Purchase Price vs Lower Operating Cost
A comparison example helps buyers see why the cheapest quotation may not be the best business decision. The numbers below are simplified, but the logic is useful for procurement screening.
| Item | Low-Price Pump | Higher-Efficiency Pump |
|---|---|---|
| Purchase cost | $8,000 | $11,000 |
| Extra purchase cost | — | $3,000 |
| Input power at duty point | 45 kW | 38 kW |
| Annual runtime | 6,000 h | 6,000 h |
| Electricity price | $0.12/kWh | $0.12/kWh |
| Annual energy cost | $32,400 | $27,360 |
| Annual energy saving | — | $5,040 |
| Simple payback on extra cost | — | 0.6 year |
| 5-year energy cost | $162,000 | $136,800 |
| 5-year energy saving | — | $25,200 |
| Lifecycle conclusion | Lower initial cost | Lower total cost if duty is correct |
In this example, the higher-efficiency pump costs $3,000 more at purchase but saves about $5,040 per year in electricity. If the duty point, supplier curve, and commissioning data are valid, the higher-efficiency option pays back quickly.
This does not mean the more expensive pump is always better. It means buyers should compare pump options by verified lifecycle cost, not only purchase price.
Purchase Price vs Lifecycle Cost: Why the Cheapest Pump May Cost More
A cheap pump can become expensive if it consumes more energy, fails more often, requires special spare parts, operates far from BEP, or needs frequent maintenance. The purchase price is visible on the quotation, but lifecycle cost is hidden in operating budgets, maintenance records, electricity bills, and downtime events.
The lowest purchase price may be acceptable for low-duty, non-critical, short-runtime applications. It is often risky for high-runtime, critical, abrasive, corrosive, or difficult-duty pump systems.
| Buying Decision | Short-Term Benefit | Long-Term Risk |
|---|---|---|
| Lowest pump price | Lower upfront cost | Higher energy, maintenance, or downtime cost |
| Oversized pump | Appears safer for future demand | Throttling, poor efficiency, seal and bearing stress |
| Small motor margin | Lower package cost | Overload trips or limited operating range |
| Cheap material | Lower purchase price | Corrosion, erosion, shorter service life |
| No instrumentation | Lower installation cost | No data to diagnose energy or failure problems |
| No spare parts plan | Lower initial budget | Longer downtime when failure occurs |
| No commissioning test | Faster handover | Hidden performance gap remains unnoticed |
| No curve verification | Easier procurement | Wrong duty point may be accepted |
A buyer should not ask only, “Which pump is cheaper?” The better question is: which pump system has the lowest verified cost per useful unit of flow over its expected service life?
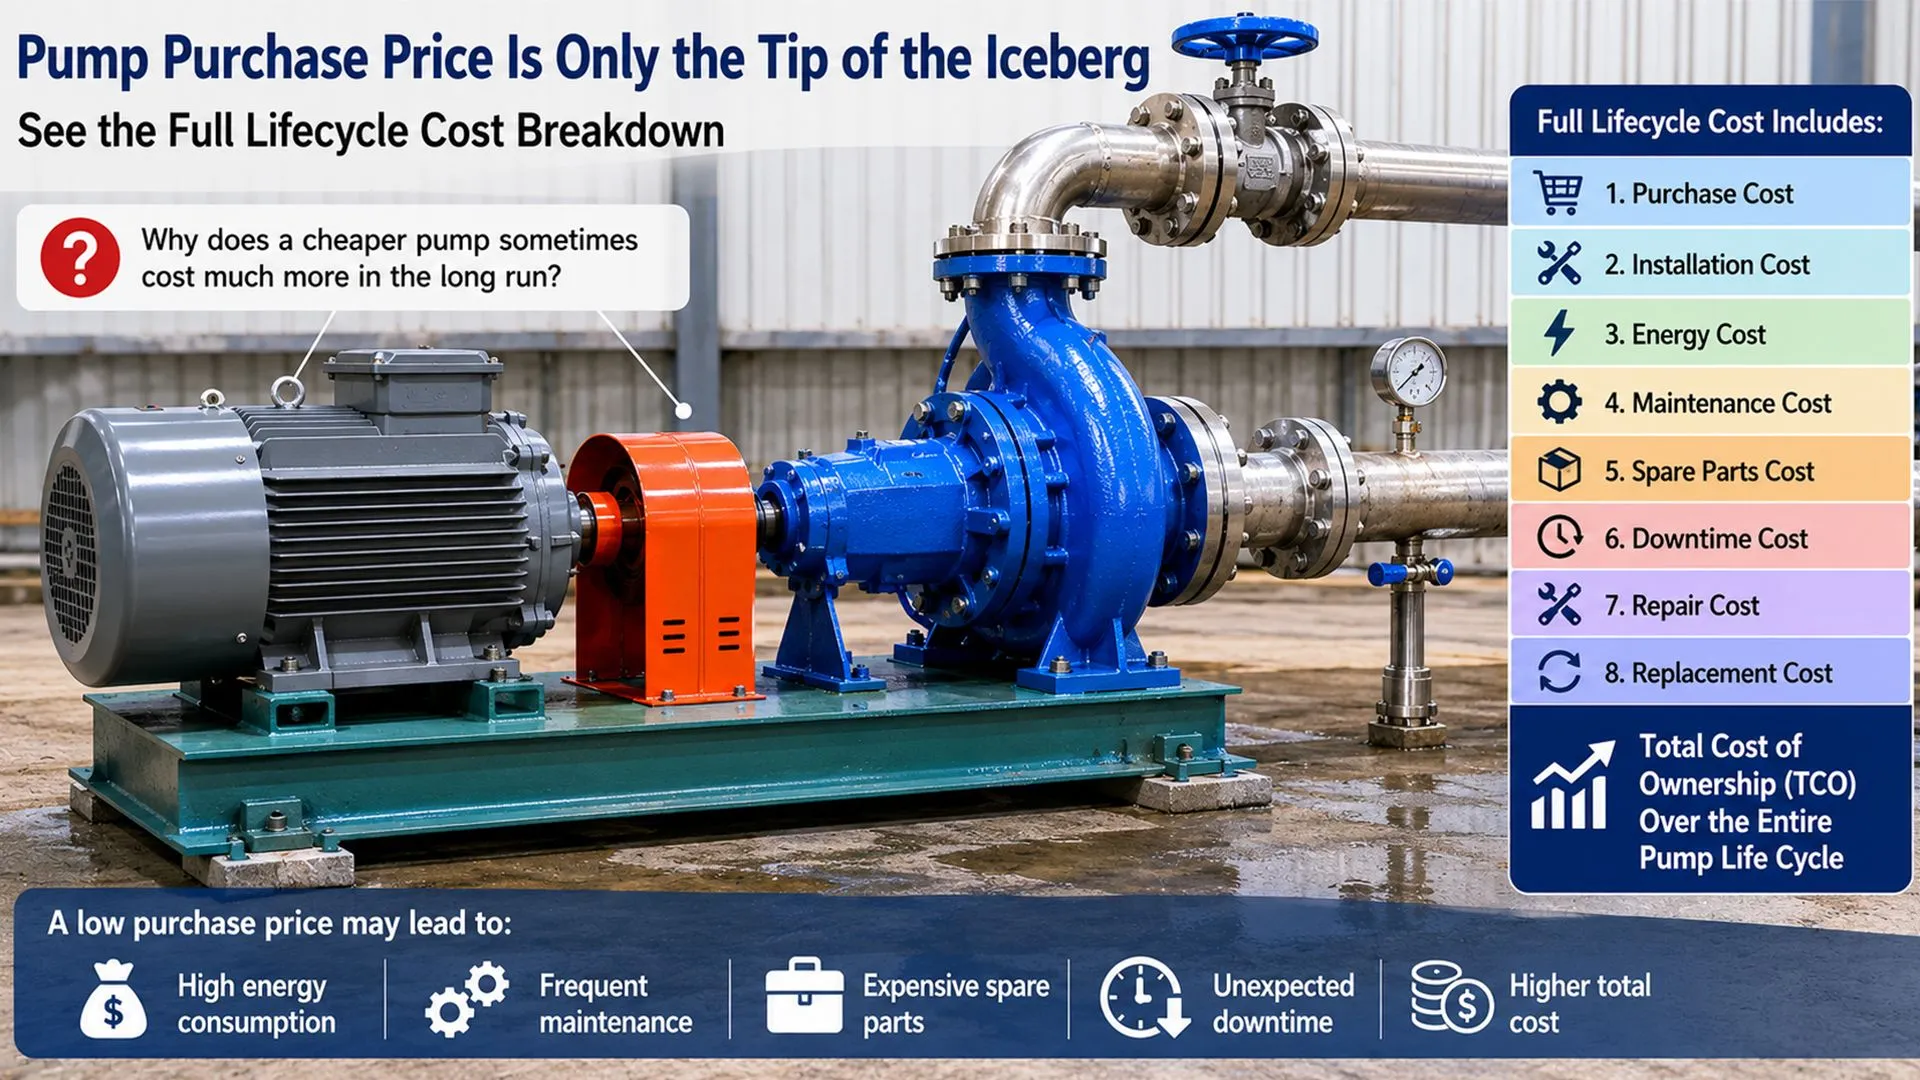
How Much Does Energy Cost Affect Pump Lifecycle Cost?
Energy cost is often the largest lifecycle cost for continuously operating pumps. A small efficiency difference can become expensive when the pump runs thousands of hours each year.
The basic energy cost formula is:
Annual Energy Cost = Input kW × Annual Operating Hours × Electricity Price
For example, if a pump consumes 75 kW and runs 6,000 hours per year at $0.12/kWh:
Annual Energy Cost = 75 × 6,000 × 0.12 = $54,000/year
If a better selection or efficiency improvement reduces power demand by 10 kW:
Annual Saving = 10 × 6,000 × 0.12 = $7,200/year
Over ten years, before considering electricity price changes, that is:
10-Year Saving = $72,000
This is why a pump with a higher purchase price may still have lower lifecycle cost if it operates closer to BEP, has better hydraulic efficiency, avoids throttling, and reduces input kW.
For teams that first need to build a field efficiency baseline, this pump efficiency improvement checklist can help compare flow, head, kW, BEP, system curve, and supplier data before calculating lifecycle cost.
Which Energy Metric Should Buyers Track?
Energy cost should not be judged only by motor nameplate power. A 90 kW motor does not mean the pump always consumes 90 kW. Buyers should track measured input kW at the actual duty point.
| Energy Metric | What It Means | Best Use |
|---|---|---|
| Input kW | Real electrical power used | Energy cost calculation |
| Shaft power | Mechanical power required by pump | Supplier curve comparison |
| Pump efficiency | Hydraulic efficiency at duty point | Pump model comparison |
| Motor efficiency | Electrical-to-mechanical efficiency | Motor selection |
| Drive efficiency | VFD or drive conversion efficiency | Variable-speed systems |
| kWh/m³ | Energy per volume delivered | Water transfer and utility systems |
| kWh per production unit | Energy per useful process output | Factory cost tracking |
| Wire-to-water efficiency | Total electrical input vs useful hydraulic output | Installed system performance |
For high-runtime pumps, buyers should request input kW or shaft power at the normal duty point, not only motor size.
Financial Decision Metrics for Pump Lifecycle Cost
Pump lifecycle decisions often involve engineering, procurement, maintenance, and finance teams. Each team may look at cost differently, so buyers should use several simple financial indicators instead of relying on purchase price alone.
| Financial Metric | What It Helps Decide | Buyer Use |
|---|---|---|
| Simple payback | How quickly extra investment is recovered | Good for energy-saving upgrades |
| Annual energy cost | Whether a high-efficiency pump is justified | Useful for high-runtime pumps |
| Downtime cost per hour | Whether standby pump or better reliability is justified | Critical for production systems |
| Repair cost ratio | Whether repair or replacement should be reviewed | Useful for aging pumps |
| Expected service life | Whether material or seal upgrade is justified | Useful for abrasive/corrosive service |
| Annualized cost | Average yearly cost over service life | Useful for comparing options |
| Spare parts lead time | Downtime exposure when failure occurs | Useful for remote or critical sites |
| Net Present Value | Discounted long-term cost or saving | Useful for large capital projects |
| Lifecycle cost per useful output | Cost per m³, ton, batch, or production unit | Best for operational benchmarking |
For small projects, simple payback and annual energy cost may be enough. For large municipal, industrial, mining, or power plant systems, buyers should also consider downtime cost, expected service life, spare parts lead time, and discounted long-term value.
How Oversizing Increases Lifecycle Pump Cost
Oversizing is one of the most common reasons lifecycle pump cost becomes higher than expected. An oversized pump may look safe during procurement because it promises extra flow or head, but that extra margin often becomes wasted energy, throttling loss, vibration, heat, seal wear, bearing stress, and maintenance cost.
Oversizing usually happens when buyers or designers add too much safety margin to flow, head, future expansion, or unknown system conditions. Some margin is necessary, but excessive margin creates long-term cost.
| Oversizing Result | Lifecycle Cost Impact | What Buyers Should Do |
|---|---|---|
| Permanent discharge throttling | Energy wasted across valve | Review impeller trim, VFD, or pump size |
| Pump runs far left of BEP | Vibration, heat, recirculation | Check minimum flow and duty profile |
| Excess pressure | Pipe, seal, and valve stress | Verify actual process pressure need |
| Continuous bypass | Non-useful circulation cost | Confirm whether bypass is required |
| Larger motor | Higher purchase and electrical infrastructure cost | Match motor to verified load |
| Larger spare parts | Higher maintenance inventory cost | Compare parts and repair cost |
| Lower efficiency at real duty | Higher electricity cost | Require curve at actual operating point |
If your system already shows throttling or high kW due to oversizing, this oversized pump energy waste guide can help buyers confirm whether the pump is producing more flow or head than the process actually needs.
How BEP Operation Reduces Lifecycle Cost
BEP means Best Efficiency Point. It is the point on the pump curve where the pump operates at its highest hydraulic efficiency for a given impeller and speed. A pump does not need to operate exactly at BEP every second, but long-term operation near a reasonable efficiency range usually lowers energy cost and mechanical stress.
When a pump operates far from BEP, lifecycle cost can rise through higher kW, vibration, shaft deflection, bearing load, seal leakage, internal recirculation, cavitation risk, and unplanned repair.
| Operating Region | Cost Impact | Buyer Decision |
|---|---|---|
| Near BEP | Lower energy and mechanical stress | Preferred for long-term operation |
| Far left of BEP | Heat, recirculation, low-flow damage | Check oversizing or throttling |
| Far right of BEP | High flow, possible motor overload, NPSH risk | Check system resistance and motor load |
| Outside preferred operating range | Higher failure and energy risk | Review selection or system correction |
| Unknown duty point | Cost cannot be predicted | Measure flow/head and plot curve |
For teams that need to evaluate whether the pump is operating in a healthy range, this pump BEP operation guide explains how to compare the actual duty point with the Best Efficiency Point before approving a long-term pump strategy.
How Maintenance Strategy Lowers Lifecycle Pump Cost
Maintenance cost is not only the price of spare parts. It includes labor, downtime, emergency repairs, production interruption, seal leakage, bearing damage, vibration monitoring, lubrication, cleaning, and replacement planning.
The lowest lifecycle cost usually comes from planned maintenance, not emergency maintenance. A pump that is allowed to run until failure may appear cheaper in the short term but can become expensive when downtime and secondary damage are counted.
| Maintenance Area | Cost Risk if Ignored | Cost-Control Action |
|---|---|---|
| Bearing lubrication | Bearing failure, shaft damage | Follow lubrication schedule |
| Alignment | Coupling wear, bearing load, vibration | Check during installation and maintenance |
| Mechanical seal | Leakage, product loss, emergency shutdown | Monitor leakage and seal flush condition |
| Wear rings | Internal recirculation, lower efficiency | Measure clearance during overhaul |
| Impeller | Erosion, imbalance, reduced output | Inspect vane condition and balance |
| Strainer/filter | Higher head loss or suction restriction | Clean based on differential pressure |
| Baseplate/foundation | Vibration and misalignment | Check grout, bolts, and soft foot |
| Vibration trend | Failure goes unnoticed | Record baseline and trend changes |
| Spare parts | Long downtime during failure | Stock critical parts based on risk |
| Maintenance records | Repeated failure not understood | Track failure mode and cost |
If energy use is rising while the pump still operates, this pump efficiency decline troubleshooting guide can help separate internal wear from system resistance, control problems, and poor operating point selection.
How Downtime Cost Changes the Pump Buying Decision
Downtime cost can be the largest hidden lifecycle pump cost in critical applications. A pump that serves a production line, cooling loop, boiler feed system, wastewater station, municipal supply, or process transfer duty may cost far more through downtime than through spare parts or energy.
Downtime cost includes lost production, emergency labor, rental pumps, overtime, expedited freight, damaged downstream equipment, environmental risk, and customer delivery delays.
Estimated Downtime Cost = Expected Downtime Hours × Cost per Hour
For example, if a production process loses $2,000 per hour and a pump failure causes 10 hours of downtime, the downtime event costs about $20,000 before repair parts and labor are included.
| Application Type | Downtime Risk | Buying Implication |
|---|---|---|
| Cooling water pump | Overheating or process shutdown | Redundancy and monitoring may be justified |
| Boiler feed pump | Safety and production risk | Reliability matters more than lowest price |
| Municipal pump station | Service interruption | Standby pump and parts availability needed |
| Wastewater pump | Overflow or environmental risk | Anti-clogging design and access matter |
| Slurry pump | Wear failure and blocked lines | Wear parts and monitoring are critical |
| Chemical transfer pump | Leakage or safety incident | Material and seal selection are critical |
| HVAC pump | Comfort or facility disruption | Control and maintenance accessibility matter |
| Irrigation pump | Crop or production loss | Seasonal reliability and service response matter |
For critical systems, buyers should evaluate redundancy, standby pump strategy, spare parts availability, local service, and monitoring. A slightly higher purchase price may be justified if it reduces emergency downtime.
How Installation Quality Affects Lifecycle Pump Cost
A well-selected pump can still become expensive if installation is poor. Bad suction layout, pipe strain, misalignment, weak foundation, missing instruments, poor valve placement, and wrong control settings can shorten pump life and increase energy cost.
Installation cost should not be minimized blindly. Correct installation reduces vibration, seal failure, bearing load, cavitation risk, and troubleshooting time.
| Installation Issue | Lifecycle Cost Impact | Corrective Principle |
|---|---|---|
| Suction elbow too close to pump | Uneven inlet flow, vibration | Provide proper straight length if possible |
| Suction pipe too small | Higher inlet loss, cavitation risk | Size suction line correctly |
| Pipe strain on pump nozzle | Misalignment and seal/bearing stress | Support piping independently |
| No pressure gauges | Hard to diagnose head and restrictions | Install suction/discharge gauges |
| No flow measurement | Operating point unknown | Add permanent or temporary measurement method |
| Poor foundation | Vibration and alignment drift | Use proper baseplate, grout, and bolts |
| Wrong check valve placement | Water hammer or reverse flow | Follow proper discharge arrangement |
| Missing isolation valves | Longer maintenance downtime | Provide maintainable valve layout |
| Poor cable sizing | Voltage drop and motor heating | Verify cable length and load |
| No commissioning baseline | Future cost trends cannot be compared | Record flow, head, kW, current, vibration |
If the pump passes factory testing but fails to meet duty after installation, buyers should check site piping, suction condition, valve position, pump speed, instrumentation accuracy, and system curve before assuming the pump is defective.
When VFD Lowers Lifecycle Pump Cost—and When It Does Not
A Variable Frequency Drive can reduce lifecycle pump cost when pump demand varies and speed reduction lowers input kW without compromising process requirements. However, VFD is not automatically the lowest-cost solution.
VFD savings are strongest when friction head is a major part of total head and the system spends many hours below peak demand. VFD savings may be limited when static head dominates, minimum flow is required, or the pump already runs near a stable duty point.
VFD savings should not be estimated only by affinity laws when static head dominates the system curve. Buyers should compare real duty profile, minimum flow limits, static head, friction head, sensor location, motor compatibility, panel environment, and commissioning cost.
| VFD Condition | Lifecycle Cost Result | Buyer Decision |
|---|---|---|
| Variable demand and high operating hours | Strong savings potential | Evaluate VFD payback |
| Mostly static head | Savings may be limited | Use system curve calculation |
| Stable flow demand | Payback may be weak | Compare fixed-speed options |
| Severe oversizing | VFD may help but may not be enough | Compare resizing or impeller trim |
| Poor sensor placement | Control instability and wasted energy | Correct instrumentation first |
| High maintenance environment | VFD panel protection needed | Include panel and service cost |
| Motor not VFD-compatible | Reliability risk | Check motor insulation and cooling |
| No commissioning verification | Savings remain unproven | Measure before/after kW |
For buyers comparing control options, this VFD vs fixed speed energy comparison guide explains when variable speed control reduces energy cost and when fixed-speed operation may be more economical.
Repair vs Replace: Which Option Lowers Lifecycle Pump Cost?
Repair is not always cheaper, and replacement is not always necessary. The correct decision depends on current performance, repair cost, energy cost, spare parts availability, downtime risk, and expected remaining life.
A pump should usually be repaired when the hydraulic selection is still correct, the casing and base structure are healthy, parts are available, and repair can restore efficiency at reasonable cost. Replacement becomes more attractive when the pump is severely oversized, inefficient at real duty, repeatedly failing, obsolete, or too expensive to maintain.
| Condition | Repair May Be Better | Replacement May Be Better |
|---|---|---|
| Pump selection still matches duty | Yes | Not necessary |
| Pump is severely oversized | Usually no | Yes |
| Repair cost is low | Yes | Not usually |
| Repair cost exceeds 50–60% of replacement | Review carefully | Often yes |
| Energy cost is high due to poor selection | No | Yes |
| Parts are available quickly | Yes | Not always |
| Parts are obsolete | No | Yes |
| Casing is in good condition | Yes | Not required |
| Repeated seal/bearing failures continue | Maybe not | Yes, if root cause is design |
| Downtime cost is high | Depends on repair time | Replacement or standby may be safer |
| Efficiency can be restored | Yes | Not always needed |
| New design improves lifecycle cost | Compare ROI | Often yes |
The 50–60% repair-cost threshold is only a screening reference. Buyers should also compare energy penalty, downtime risk, parts availability, remaining casing life, expected service life, and whether the original pump selection still matches the real duty.
The key question is not “Can this pump still run?” The key question is: does this pump still deliver the required duty at an acceptable energy, maintenance, and downtime cost?
Material, Seal, and Bearing Choices That Lower Lifecycle Cost
Material, seal, and bearing choices strongly affect lifecycle cost in corrosive, abrasive, hot, or dirty liquid services. A cheaper material may fail early. An overly expensive material may not be justified for clean water or low-risk service.
The best choice depends on liquid chemistry, solids content, temperature, pressure, duty cycle, maintenance skill, and downtime cost.
Material upgrade is justified when corrosion, erosion, temperature, chemical compatibility, or downtime risk causes repeated failure. It is not automatically justified for clean water, low-runtime, non-critical service where standard material already provides acceptable service life.
| Component Choice | Low-Cost Mistake | Better Lifecycle Approach |
|---|---|---|
| Cast iron casing | Used in corrosive liquid | Match material to liquid chemistry |
| Stainless steel casing | Used when not needed | Use when corrosion justifies cost |
| Standard mechanical seal | Used in abrasive or dry-running risk | Match seal faces and flush plan |
| Packing | Chosen only for low price | Consider leakage, maintenance, and water loss |
| Bearing grade | Lowest-cost bearing | Use quality bearings for critical/high-load duty |
| Wear ring material | Poor compatibility | Select for wear and corrosion resistance |
| Impeller material | Erodes quickly in solids | Choose abrasion-resistant option |
| Coating | Used as substitute for wrong material | Use coating only when suitable |
| Coupling | Low-grade or poorly aligned | Use correct coupling and alignment procedure |
For lifecycle cost, the right material is not always the most expensive material. It is the material that delivers the required service life with acceptable maintenance and downtime risk.
Supplier Verification: What Data Proves Lower Lifecycle Pump Cost?
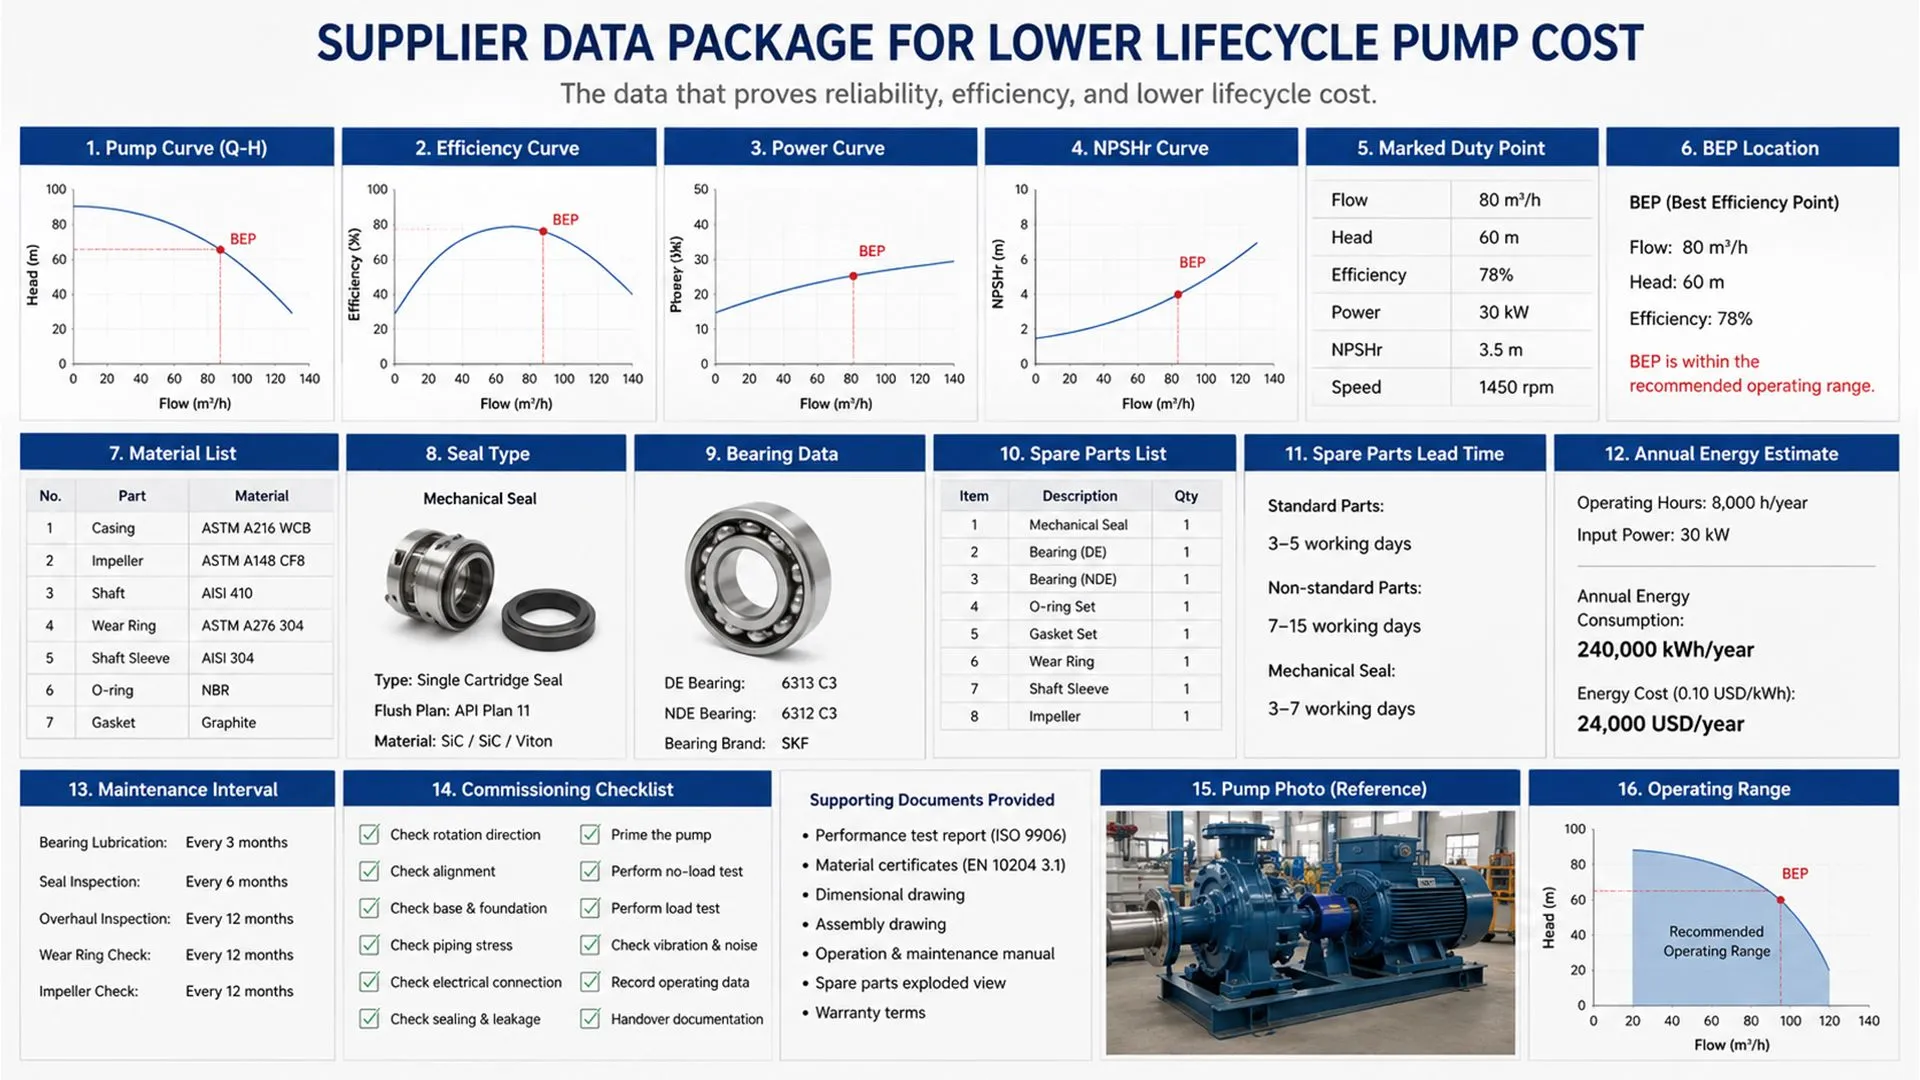
A supplier should prove lifecycle cost with data, not only claim that a pump is “high efficiency” or “low maintenance.” The buyer should request curves, assumptions, spare parts data, and commissioning support before purchase.
| Supplier Data Required | Why It Matters |
|---|---|
| Pump curve | Confirms flow-head performance |
| Efficiency curve | Shows efficiency at real duty |
| Power curve | Shows shaft power and motor load |
| NPSHr curve | Confirms suction margin |
| BEP and preferred operating range | Shows long-term operating health |
| Selected impeller diameter | Helps evaluate trimming and correction |
| Material list | Confirms corrosion and wear suitability |
| Seal type and seal plan | Affects leakage, maintenance, and reliability |
| Bearing and lubrication data | Affects maintenance interval |
| Spare parts list and price | Shows long-term maintenance cost |
| Spare parts lead time | Shows downtime exposure after failure |
| Delivery time for critical parts | Affects emergency replacement planning |
| Motor efficiency and service factor | Affects energy and overload margin |
| VFD calculation if applicable | Shows expected energy savings |
| Annual energy estimate | Supports lifecycle comparison |
| Factory test report if required | Confirms performance before shipment |
| Commissioning checklist | Confirms field performance after installation |
A supplier that only provides model, flow, head, and price is not giving enough information for lifecycle cost evaluation.
RFQ Checklist: What Buyers Should Include to Reduce Lifecycle Cost
A strong RFQ helps suppliers quote the right pump system and reduces hidden lifecycle cost. A weak RFQ usually produces cheap but incomplete quotations.
Buyers should include:
- normal flow, minimum flow, and peak flow
- total dynamic head
- static head
- pipe length, diameter, and major fittings
- suction condition and liquid level range
- liquid density, viscosity, temperature, and vapor pressure
- solids content, particle size, or corrosive content
- operating hours per day and per year
- duty profile by season or production condition
- required control method
- electricity price or energy cost basis
- reliability requirement and criticality
- downtime cost estimate if available
- preferred material and seal requirements
- required instruments
- spare parts requirement
- recommended spare parts list
- spare parts price and lead time
- commissioning acceptance criteria
- required pump curve, efficiency curve, power curve, and NPSHr curve
- expected service life or lifecycle comparison period
The more accurate the RFQ, the more accurate the lifecycle cost comparison. If the buyer does not provide real duty data, suppliers may add excessive safety margin or quote based on assumptions.
Commissioning Checklist: How to Confirm Lifecycle Cost Is Under Control
Commissioning is where lifecycle cost assumptions become measurable reality. A pump that starts successfully is not necessarily operating at low lifecycle cost.
During commissioning, buyers should record:
| Commissioning Data | Why It Matters | Target Result |
|---|---|---|
| Actual flow | Confirms useful output | Meets process requirement |
| Suction pressure | Confirms inlet condition | Stable and sufficient |
| Discharge pressure | Confirms system head | Matches selected duty |
| Total dynamic head | Confirms curve position | Close to design duty |
| Input kW | Confirms energy cost | Matches power curve |
| Motor current | Confirms overload safety | Within rated limit |
| Pump speed | Confirms fixed or VFD operation | Matches control plan |
| Valve position | Finds throttling loss | No unnecessary throttling |
| Bypass flow | Finds wasted circulation | No excessive bypass |
| Vibration | Confirms mechanical stability | Within acceptable limit |
| Bearing temperature | Confirms mechanical health | Stable |
| Seal leakage | Confirms seal suitability | Normal or within limit |
| Control setpoint | Confirms real process need | Not higher than necessary |
| Noise/cavitation | Confirms suction health | No abnormal cavitation |
| Baseline record | Supports future comparison | Stored for maintenance team |
A lifecycle cost strategy fails if commissioning data is not recorded. Without baseline data, future teams cannot know whether energy cost, vibration, leakage, or maintenance frequency has increased.
Cost Reduction Priority Matrix: What Should Buyers Do First?
Not every cost-saving action has the same payback or risk. Buyers should start with low-risk, data-driven actions before approving expensive retrofits.
| Cost Reduction Action | Cost Level | Risk Level | When to Prioritize |
|---|---|---|---|
| Measure flow, head, and kW baseline | Low | Low | Always first |
| Verify pump curve and BEP | Low | Low | Before repair or replacement |
| Clean clogged strainers or filters | Low | Low | When differential pressure is high |
| Correct valve and bypass position | Low | Medium | After checking motor load and process limits |
| Fix suction layout problems | Medium | Medium | When cavitation or poor inlet condition exists |
| Improve alignment and foundation | Medium | Low to medium | When vibration or seal failure appears |
| Repair worn impeller/wear rings | Medium | Medium | When efficiency decline is confirmed |
| Trim impeller | Medium | Medium | When pump is moderately oversized |
| Add VFD | Medium to high | Medium | When duty varies and system curve supports savings |
| Replace motor | Medium | Low to medium | When motor efficiency or loading is poor |
| Replace pump | High | Medium | When selection is severely wrong or repair ROI is weak |
| Redesign piping | High | High | When system resistance is structurally excessive |
| Add standby pump | High | Medium | When downtime cost is high |
The best lifecycle cost decision is usually not the cheapest immediate action. It is the action that reduces verified long-term cost without increasing reliability or safety risk.
What Usually Reduces Lifecycle Pump Cost?
This summary table helps buyers connect common lifecycle cost problems with the most logical first action. It is useful for procurement meetings because it turns technical symptoms into purchasing and maintenance decisions.
| Cost Problem | Best First Action |
|---|---|
| High energy cost | Verify kW, BEP, efficiency curve, and throttling |
| Frequent seal failure | Check suction condition, alignment, and seal plan |
| High downtime cost | Add standby strategy, spare parts, and monitoring |
| Repeated repair | Compare repair cost vs replacement ROI |
| Supplier data missing | Request curves, energy estimate, and parts cost |
| Oversized pump | Review impeller trim, resizing, or VFD |
| Long spare parts lead time | Stock critical spares or choose better-supported model |
| Poor installation reliability | Review suction layout, pipe strain, foundation, and alignment |
| High maintenance labor | Improve access, monitoring, and planned maintenance |
| Unclear cost responsibility | Define owner for data, maintenance, and commissioning records |
The fastest savings often come from correcting measurable waste. The largest risk reduction often comes from reducing downtime exposure.
When NOT to Lower Pump Cost Aggressively
Cost reduction should never compromise safety, process reliability, environmental protection, or required hydraulic performance. Some pump systems need margin, redundancy, or premium materials because the cost of failure is high.
Do not reduce cost aggressively when:
- the pump serves fire protection
- the pump protects critical cooling
- the system handles hazardous chemicals
- seal leakage creates safety or environmental risk
- slurry velocity must prevent solids settlement
- boiler feed pressure must remain stable
- a municipal or wastewater system requires reliability
- downtime cost is much higher than equipment cost
- the liquid is corrosive, abrasive, hot, or toxic
- future operating conditions are uncertain
- standards or project specifications require specific materials or redundancy
The goal is not to make the pump as cheap as possible. The goal is to make the required pump service as economical and reliable as possible over its full operating life.
Responsibility Boundary: Who Controls Lifecycle Pump Cost?
Lifecycle pump cost is shared across procurement, engineering, installation, operations, maintenance, and suppliers. If each team optimizes only its own budget, total ownership cost often increases.
| Role | Cost Responsibility | Common Mistake |
|---|---|---|
| Buyer / Procurement | Compare total cost, not only price | Selects lowest quote without curves |
| Engineering Designer | Define correct duty and system curve | Adds excessive safety margin |
| Pump Supplier | Provide correct selection and lifecycle data | Quotes model without efficiency proof |
| Installer | Build correct piping, foundation, alignment | Creates pipe strain or suction problems |
| Electrical Team | Verify motor, VFD, cable, and power data | Ignores hydraulic operating point |
| Operations Team | Operate at correct setpoints and valve positions | Runs throttled or bypassed system |
| Maintenance Team | Prevent wear and track failure cost | Repairs repeatedly without root cause |
| Management | Approve lifecycle-based investment | Focuses only on capital cost |
The best lifecycle cost results come when procurement and engineering evaluate the pump system together before purchase.
FAQ: Buyer Questions About How to Lower Lifecycle Pump Cost
Buyers usually ask these questions when they need to justify pump investment, compare suppliers, reduce electricity cost, or decide whether to repair or replace an existing pump.
What is lifecycle pump cost?
Lifecycle pump cost is the total cost of buying, installing, operating, maintaining, repairing, and replacing a pump system over its useful life. It includes purchase price, energy cost, maintenance, spare parts, downtime, efficiency loss, and replacement cost.
What is the difference between lifecycle cost and total cost of ownership?
In pump procurement, lifecycle cost and total cost of ownership are often used similarly. Both refer to the full cost of owning and operating the pump, not only the purchase price. Lifecycle cost usually emphasizes the cost over a defined service-life period, while total cost of ownership may also include ownership policies, support, and operational management.
Why is the cheapest pump often more expensive over time?
The cheapest pump may have lower efficiency, shorter service life, higher spare parts cost, poor material compatibility, or more frequent failures. When energy and downtime are included, the lowest initial price may become the highest lifecycle cost.
When is a low-cost pump acceptable?
A low-cost pump may be acceptable for low-runtime, non-critical, clean-water service when the duty is simple, spare parts are easy to obtain, downtime cost is low, and the efficiency difference between options is small. It is less suitable for high-runtime, critical, abrasive, corrosive, or hard-to-maintain systems.
What is the biggest lifecycle cost for industrial pumps?
For pumps with long operating hours, energy cost is often the largest lifecycle cost. For critical production or municipal systems, downtime cost may be even larger than energy or purchase cost.
How do I calculate pump energy cost?
Use the formula: annual energy cost = input kW × annual operating hours × electricity price. For accurate comparison, use measured or supplier-provided kW at the actual duty point, not only motor nameplate power.
How do I estimate downtime cost per hour?
Estimate downtime cost by adding lost production value, labor cost, emergency repair cost, rental equipment, wasted materials, restart cost, and possible delivery penalties. Even a rough downtime cost per hour helps justify standby pumps, spare parts, or better reliability.
Should pump lifecycle cost include spare parts lead time?
Yes. Spare parts lead time affects downtime risk. A low-cost pump with slow spare parts support may become expensive if a seal, bearing, impeller, or wear ring failure stops production for days or weeks.
How does BEP affect lifecycle cost?
Operating near BEP usually reduces energy waste, vibration, bearing stress, seal problems, and internal recirculation. Operating far from BEP can increase both energy cost and maintenance cost.
Can VFD lower lifecycle pump cost?
Yes, if demand varies and speed reduction reduces input kW for many operating hours. VFD may not lower lifecycle cost when static head is high, demand is stable, minimum flow is required, or the VFD system is not properly commissioned.
Should I repair or replace an old pump?
Repair is better when the pump selection is still correct, parts are available, the casing is healthy, and repair restores efficiency at reasonable cost. Replacement is better when the pump is severely oversized, inefficient, obsolete, repeatedly failing, or expensive to maintain.
Does pump material affect lifecycle cost?
Yes. Wrong material can cause corrosion, erosion, leakage, and premature failure. The best material is not always the most expensive one; it is the material that provides reliable service life for the liquid and operating condition.
How can I reduce pump maintenance cost?
Use correct selection, proper installation, alignment, lubrication, seal monitoring, vibration trending, strainer cleaning, and planned spare parts. Reducing maintenance cost starts with preventing repeated failure, not only buying cheaper parts.
What data should I request from suppliers to compare lifecycle cost?
Request pump curve, efficiency curve, power curve, NPSHr curve, BEP, selected duty point, motor load, material list, seal type, bearing data, spare parts price, spare parts lead time, annual energy estimate, maintenance interval, factory test data, and commissioning checklist.
Can oversizing increase lifecycle pump cost?
Yes. Oversizing can cause throttling, bypass flow, poor BEP operation, higher energy cost, vibration, seal wear, and bearing stress. Excessive safety margin often becomes long-term operating cost.
How do installation mistakes increase lifecycle cost?
Poor suction layout, pipe strain, weak foundation, missing instruments, bad alignment, and incorrect valve placement can cause vibration, cavitation, seal failure, bearing damage, and inefficient operation.
What is the best way to reduce pump downtime cost?
Use correct pump selection, standby strategy for critical systems, proper spare parts inventory, monitoring, planned maintenance, and commissioning baseline data. For critical pumps, redundancy may cost less than unexpected downtime.
Should lifecycle cost be included in pump RFQ?
Yes. The RFQ should ask for energy estimate, pump curve, efficiency curve, power curve, operating point, material details, spare parts cost, spare parts lead time, maintenance interval, and commissioning requirements. Without these, suppliers cannot quote true lifecycle value.
How often should lifecycle pump cost be reviewed?
Lifecycle cost should be reviewed during new purchase, commissioning, major maintenance, process changes, rising energy cost, repeated failures, and before deciding whether to repair or replace an old pump.
Conclusion: Lower Lifecycle Pump Cost by Buying and Operating the Pump as a System
Lowering lifecycle pump cost requires a system view. A pump is not only a purchase item; it is an operating asset that consumes electricity, needs maintenance, affects production reliability, and creates hidden cost when selected or installed incorrectly.
The best way to lower lifecycle pump cost is to define the real duty profile, select the pump near its efficient operating range, avoid unnecessary oversizing, verify supplier curves, control energy cost, install the system correctly, maintain wear parts, monitor performance, and use commissioning data as a baseline.
The practical procurement rule is clear:
Do not approve a pump only because its purchase price is lower. Approve it because its verified energy cost, maintenance cost, downtime risk, spare parts availability, spare parts lead time, and expected service life make sense over the full lifecycle.
A well-selected pump system may cost more at purchase but save more through lower kW, fewer failures, shorter downtime, longer service life, and better process reliability. A cheap pump without lifecycle verification may only move the cost from the purchase order to the electricity bill, maintenance budget, or emergency repair record.
Get A Quote

Get A Quote
0 Comments